Figure 3.
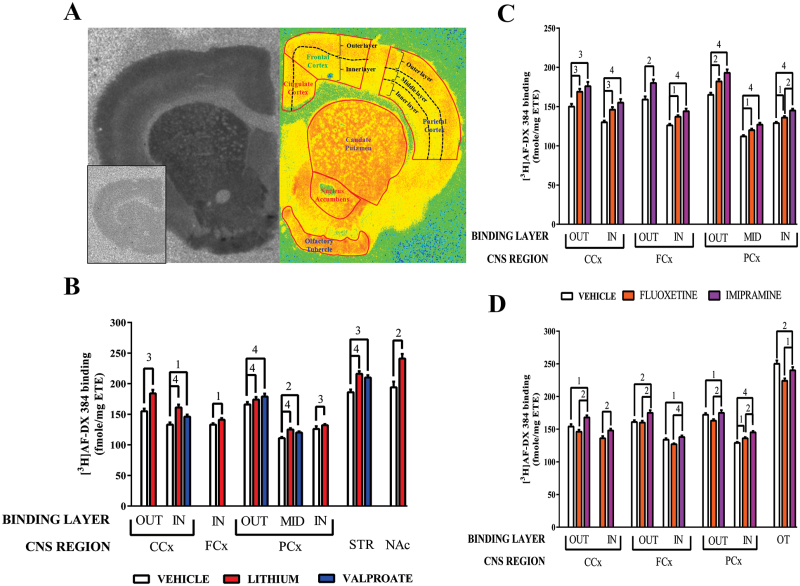
(A) A typical autoradiograph of the total binding of [3H]AF-DX 384 to rat CNS (left hemisphere) with non-specific binding shown as a boxed insert. The right hemisphere is a pseudo-colour section showing the delineation of CNS regions based on the basis of cytoarchitecture and layers of radioligand binding in the rat cortex.
(B) The specific binding (mean ± SEM) of [3H]AF-DX 384 to rat CNS following 28 days treatment with vehicle, lithium (1.8g lithium carbonate / day) or valproate (12g sodium valproate / day).
(C) The specific binding (mean ± SEM) of [3H]AF-DX 384 to rat CNS following 10 days treatment with vehicle, fluoxetine (20mg / kg / day) or imipramine (10mg / kg / day).
(D) The specific binding (mean ± SEM) of [3H]AF-DX 384 to rat CNS following 28 days treatment with vehicle, fluoxetine (20mg / kg / day) or imipramine (10mg / kg / day).
1p < 0.05, 2p < 0.01, 3p < 0.001, 4p < 0.0001 In = inner layer, Out = outer layer

