Figure 3.
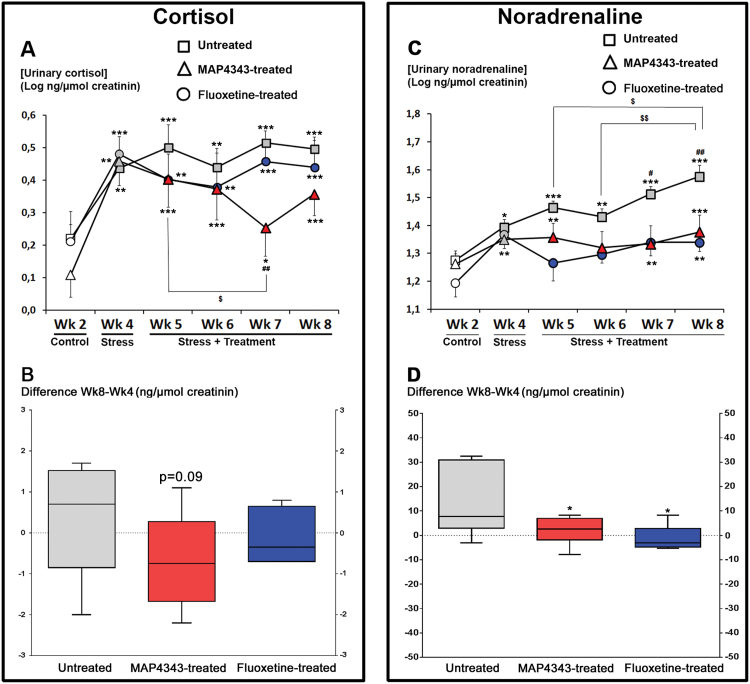
Effects of 4-week administration of MAP4343 and fluoxetine on urinary hormone levels in stressed tree shrews. A, C: Curves representing urinary cortisol (A) or noradrenaline (C) concentrations during the whole experimental period in animals receiving vehicle (squares), MAP4343 (triangles) or fluoxetine (circles). Data, expressed as the log of ng of cortisol or noradrenaline per µmol of creatinine, are weekly means±SEM calculated from daily measurements in independent animals (n=5–8). White items represent the values obtained during the control period, grey items represent the values obtained during the stress period without treatment and red or blue items represent the values obtained during the stress period with MAP4343 or fluoxetine treatment, respectively. *P<.05, **P<.01 and ***P<.001 when compared to the control period (Wk2); # P<.05 and ## P<.01 when compared to the first stress period (Wk4); $ P<.05 and $$ P<.01 when compared between the indicated weeks (One-way ANOVA for repeated measures followed by a Fisher’s LSD test to compare weekly means within each respective group). B, D: Boxplots showing changes of urinary cortisol (B) or noradrenaline (D) concentrations between the beginning and the end of the stress period in untreated (grey bar), MAP4343-treated (red bar) or fluoxetine-treated (blue bar) group. Data are difference scores obtained between Wk8 and Wk4. *P<.05 and **P<.001 as compared to untreated group (One-way ANOVA followed by a Fisher’s LSD post hoc test).

