Figure 6.
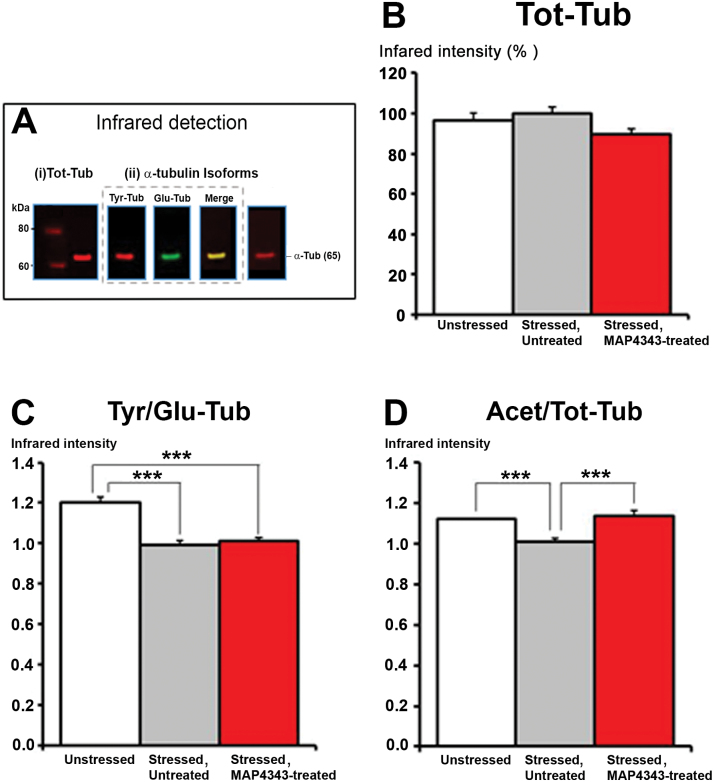
Effects of 4-week administration of MAP4343 on alpha-tubulin isoforms in hippocampi from stressed tree shrews. A: Representative Western blot showing infrared specific detection of proteins: (i) total α-Tubulin in red (Tot-Tub), (ii) α-tubulin isoforms, i.e. tyrosinated α-Tubulin in red (Tyr-Tub), detyrosinated α-Tubulin in green (Glu-Tub) and acetylated α-Tubulin in red (Acet-Tub). B-D: Histograms showing the Tot-Tub (B), the Tyr/Glu-Tub ratio (C), the Acet/Tot-Tub ratio (D) in control tree shrews (white bar; “Unstressed” group), in stressed tree shrews receiving vehicle (grey bar; “Stressed, Untreated” group) or in stressed tree shrews treated with MAP4343 (red bar; “Stressed MAP4343-treated” group). Data, expressed as percentage of infrared intensity (B) or ratio of two intensities (C, D) are means ± SEM obtained from independent animals (n=6 per group). ***P<.001 when compared between the indicated groups (Kruskall-Wallis ANOVA, followed by Dunn’s post-hoc test).

