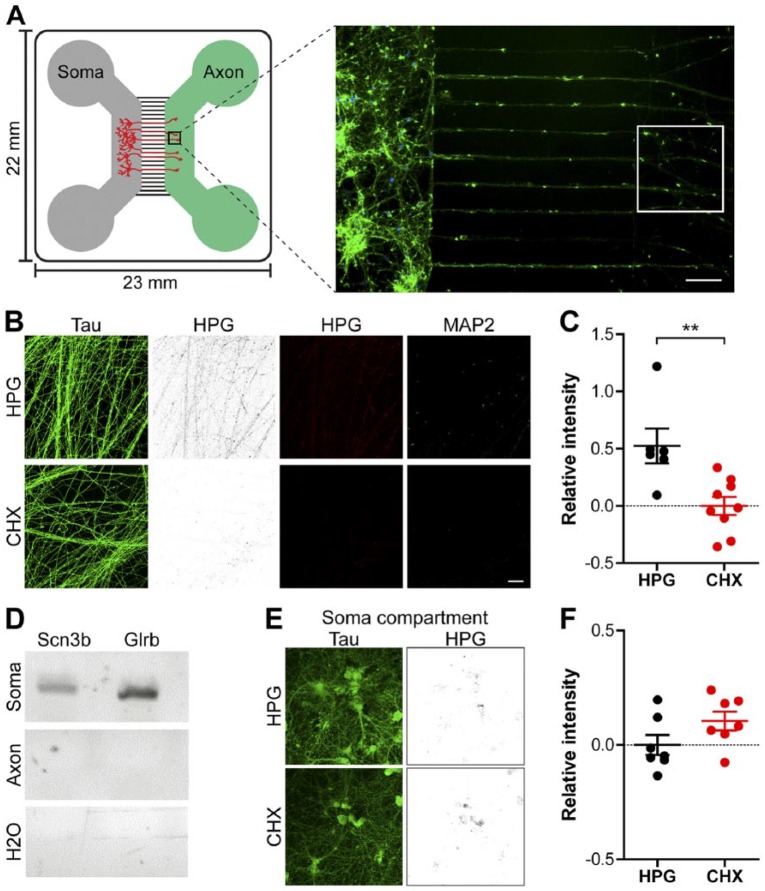
Figure 3.
Nascent protein tagging in axons of cortical neurons growing in microfluidic chambers. (A) Schematic representation of a compartmentalized microfluidic chamber with the grey channel holding the cells from which the axons will originate. These will grow through the middle microgrooves towards the axon chamber (green). Right: A representative micrograph of growing axons from DIV 7 cortical neurons stained with phalloidin (green) and DAPI (blue). The white insert denotes the typical area in which the axonal HPG signal is measured. (B) Representative images of axons treated with HPG alone or combined with the translation inhibitor CHX; these compounds were added to the axon compartment and fluidically isolated. Neurons were stained for Tau (green) and HPG incorporation (inverted greyscale and red) and the overlay of the two fluorophores. (C) Quantification of the HPG signal in immature axons relative to axons treated with CHX. (D) Agarose gel electropherogram of the soma-enriched genes Scn3b and Glrb after RT-PCR amplification of RNA samples isolated from the soma or axon compartment including a H2O-negative RT-PCR control. (E) Representative images of cells within the soma compartment of the axon chamber in which only the axon compartment was treated with HPG. Neurons were stained for Tau (green) and HPG incorporation (inverted greyscale and red). (F) Quantification of the HPG signal in the soma compartment compared with cells treated with CHX. Data represent the mean ± SEM and single values shown for n=6 to 9 chambers collected from three independent experiments. CHX, cyclohexamide; DIV, days in vitro; HPG, homopropargylglycine. p-values are determined by two-tailed unpaired Students t-test. **p<0.01. Scale (A, B, E) 50 µm.

