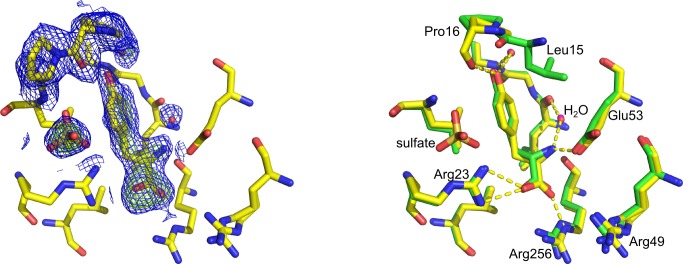
Fig 6. d-Tyr in the Tyr site (pdb id 5E4N).
Left: Part of the electron density map in site 3 with d-Tyr bound. The model conformation for the Pro16 loop is in good agreement with the map, the omit map shows the density for d-Tyr, water molecules and a sulfate ion. 2Fo-Fc map contoured at 1.0 σ (blue mesh) and Fo-Fc omit map contoured at 3.0 σ (green mesh). Right: Comparison of l-Tyr (green sticks, water molecules shown as magenta spheres) and d-Tyr (yellow sticks, water molecules shown as red spheres) binding mode in the Tyr site. The sulfate ion is shown in gold (sulfur) and red (oxygen).

