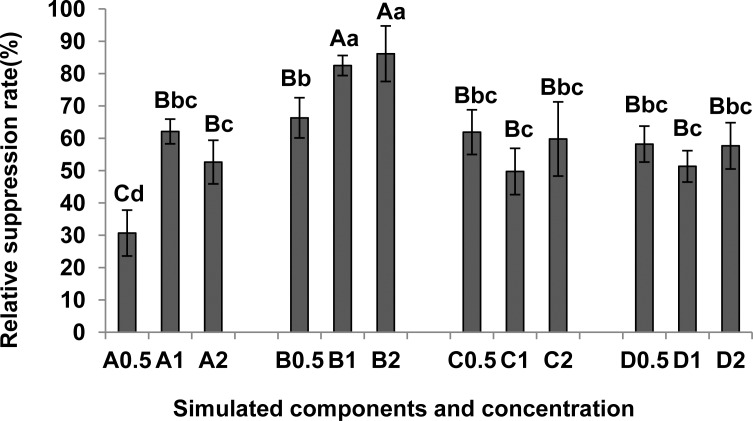
Fig 4. Effects of simulated components on relative suppression of M. incognita egg hatch.
A, 2,6-Di-tert-butyl-p-cresol; B, L-ascorbyl-2,6-dipalmitate; C, dibutyl phthalate; D, dimethyl phthalate; 0.5,0.5 mmol·L-1; 1,1 mmol·L-1; 2,2 mmol·L-1. Total number of J2 in each treatment (1.0% ethanol as control) was calculated at 8d after starting the assay. Relative suppression rate (%) = (number of J2 in control—number of J2 in treatment) / number of J2 in control × 100. Each bar represents the mean, and error bars indicate standard error of the mean from three replicates. Capital and lower case letters indicate significant group differences at the levels of 0.01 and 0.05, respectively.

