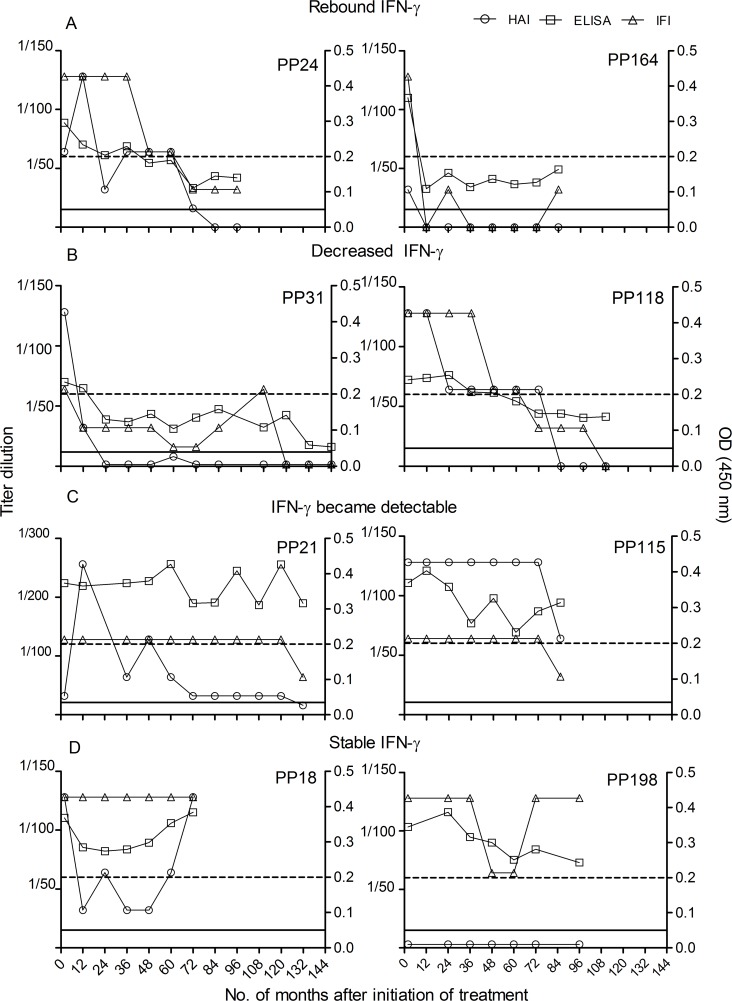
Fig 2. Evolution of T. cruzi-specific humoral responses in relation to changes in T cell responses after treatment with benznidazole.
T. cruzi-specific humoral responses were measured at different time points after benznidazole treatment. by enzyme-linked immunosorbent assay (ELISA), indirect hemagglutination (IHA) and indirect immunofluorescence (IFI). Each panel exhibits representative humoral responses for single patients with different kinetics of IFN-γ producing T cells after benznidazole treatment. A) Parasite-specific T cell responses became undetectable after treatment and experienced a rebound thereafter. B) Parasite-specific T cell responses decreased after treatment. C) Undetectable cytokine-producing T cells prior to treatment became detectable after treatment. D) The frequencies of cytokine-producing T cells did not change relative to pretreatmentTime 0 indicates the assay point just prior to benznidazole treatment. Broken lines indicate the cut-off value for ELISA assays; full lines indicate the cut-off value for IHA and IFI assays.

