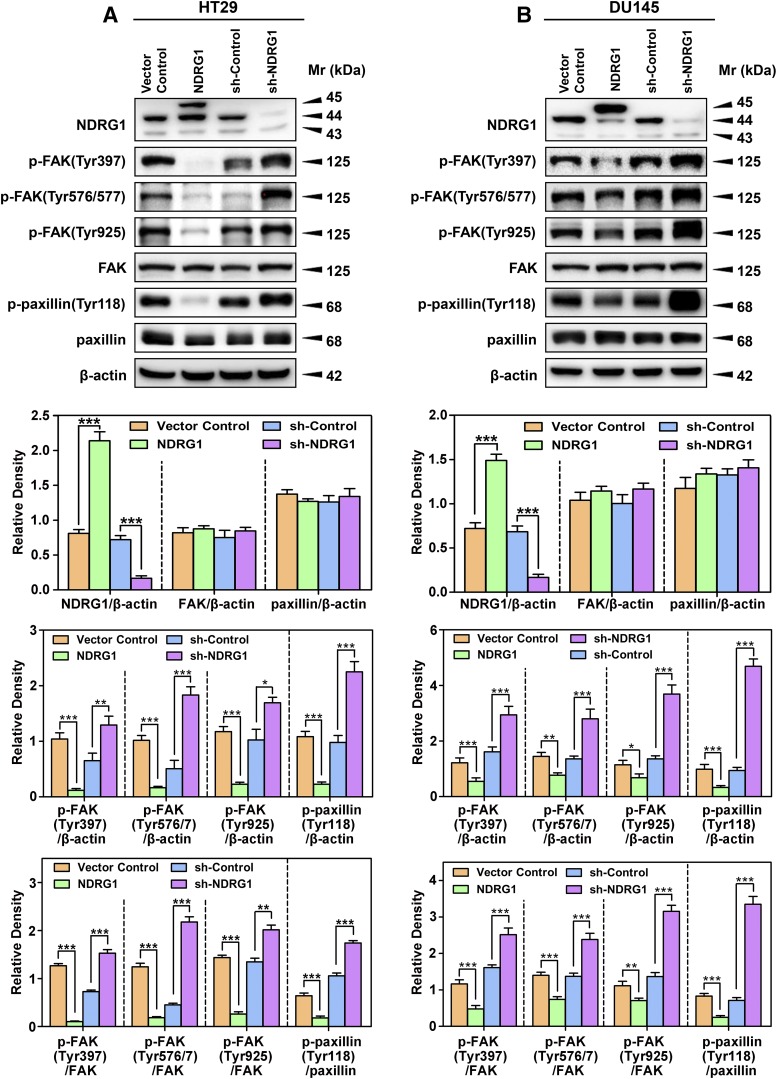
Fig. 2.
NDRG1 expression inhibits phosphorylation of FAK and paxillin using HT29 (A) and DU145 (B) cells. Immunoblotting was conducted to examine NDRG1 expression, phosphorylation of FAK (Tyr397, Tyr567/7, and Tyr925), total FAK, phosphorylation of paxillin (Tyr118), and total paxillin using NDRG1 overexpressing and silencing (sh-NDRG1) models and their respective controls in both cell types. Immunoblots shown are representative of three independent experiments. Densitometry for NDRG1 and total FAK/paxillin expression are expressed relative to the loading control, β-actin, whereas the phosphorylation levels for FAK and paxillin are displayed both relative to β-actin and as a ratio of their respective total protein levels, as shown on separate graphs. Densitometry data are shown as mean ± S.D. relative to the respective vector control or sh-Control cells as appropriate (3–5 experiments). *P < 0.05; **P < 0.01; ***P < 0.001.

