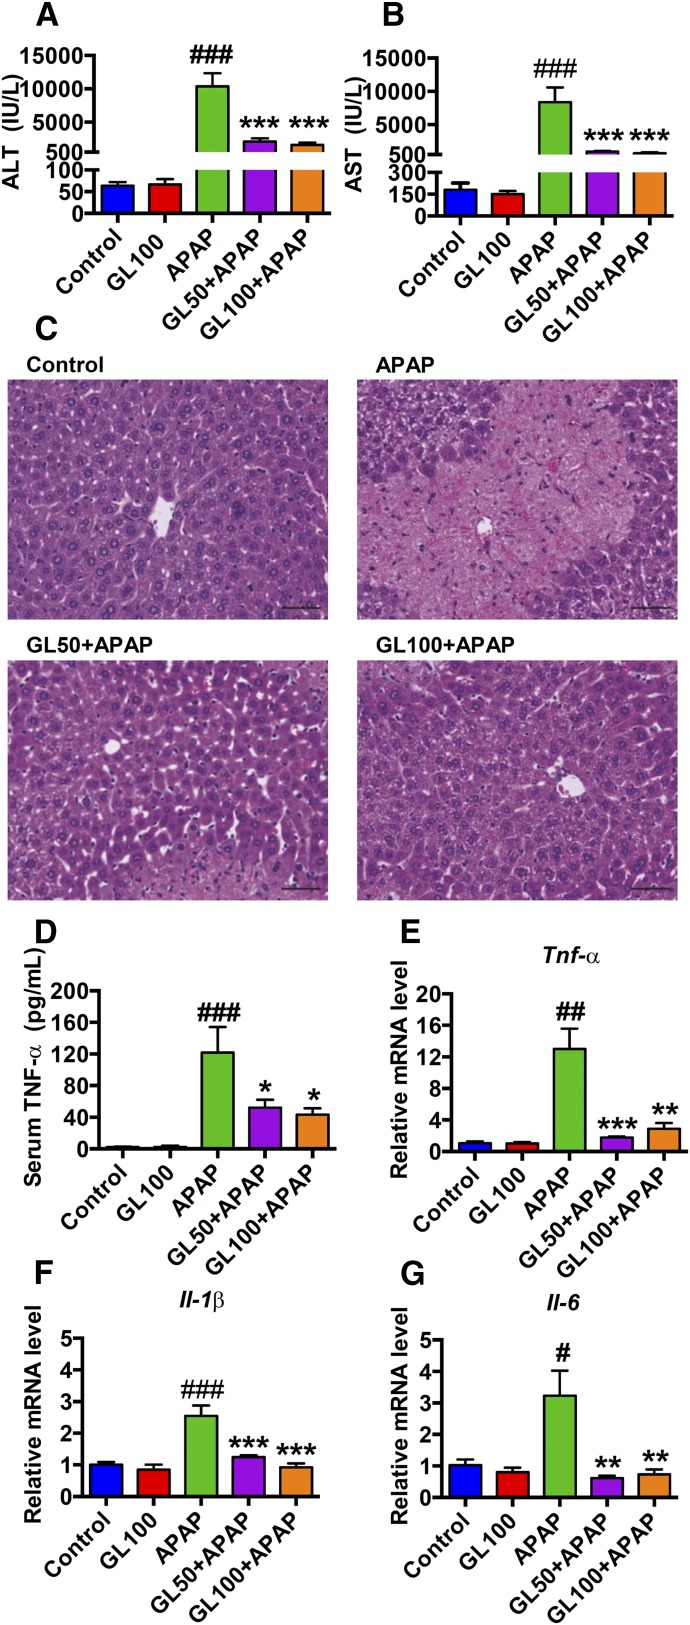
Fig. 1.
GL pretreatment reduces serum transaminases, improves liver histology, and normalizes inflammation. (A, B) Serum ALT and AST levels. (C) H&E staining of liver sections. Original magnification, 20×; black scale bar, 50 µm. (D) Serum TNFα levels. (E–G), Relative mRNA level of TNFα, IL-1β, and IL-6 (n = 6–8 in each group). Control, saline-treated control mice; GL100, only GL 100 mg/kg-treated mice; APAP, saline/APAP-treated mice; GL50 + APAP, GL 50 mg/kg/APAP-treated mice; GL100 + APAP, GL 100 mg/kg/APAP-treated mice. Data are expressed as mean ± S.E.M. #P < 0.05, ##P < 0.01, and ###P < 0.001 versus control mice. *P < 0.05, **P < 0.01, and ***P < 0.001 versus APAP-overdosed mice.

