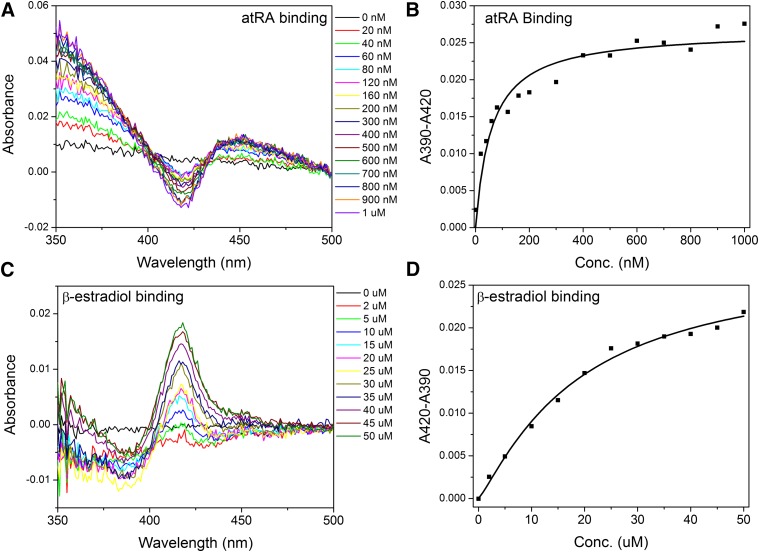
Fig. 1.
Representative difference in binding spectra induced by ligand binding to CYP2W1. (A) Type 1 difference in binding spectrum induced by titration of 2 µM CYP2W1 with atRA. The atRA absorbance was normalized by adding atRA to both the sample and reference cuvettes. The difference spectra were obtained by subtracting the ligand-free absolute spectrum from the ligand-bound spectra. (B) The difference between absorbance at 390 nm and 420 nm was plotted against the atRA concentration, and data were fitted to the Morrison equation to obtain a binding constant. (C) Reverse type 1 difference in binding spectrum induced by titration of 2 µM CYP2W1 with 17β-estradiol. (D) The difference between the absorbance at 390 nm and 420 nm was plotted against the 17β-estradiol concentration. The data were fitted to the Hill equation to obtain a binding constant.

