Fig. 3.
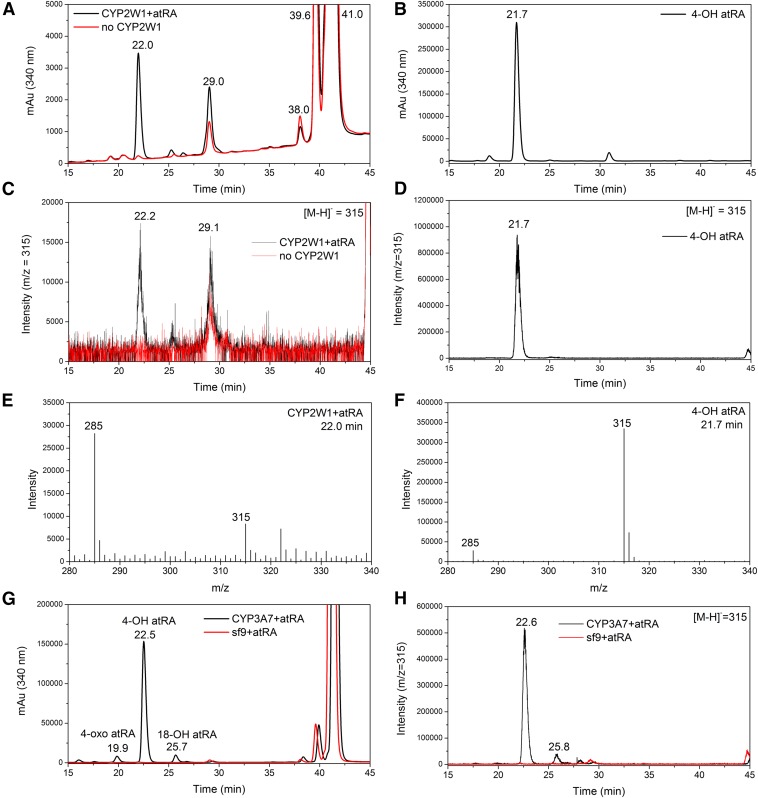
LC-MS analysis of CYP2W1 oxidation of atRA. (A) LC chromatogram with the detector set at 340 nm of the metabolites of atRA generated by incubation with CYP2W1. The red trace is incubation without CYP2W1, and the black trace is complete incubation with the enzyme present; (B) LC chromatogram with the detector set at 340 nm of authentic 4-hydroxy atRA; (C) Extracted ion (m/z = 315) chromatogram in negative ES mode of atRA metabolites generated by incubation with CYP2W1; (D) extracted ion (m/z = 315) chromatogram of authentic 4-hydroxy atRA; (E) EI-mass spectrum of the peak eluted at 22.0 minutes in Fig. 3C; and (F) EI-mass spectrum of the peak eluted at 21.7 minutes in Fig. 3D; LC-MS analysis of the CYP3A7-catalyzed oxidation of atRA. (G) LC chromatogram with detector at 340 nm. The red trace is incubation without enzyme, and the black trace is complete incubation with CYP3A7 present; (H) extracted ion (m/z = 315) chromatogram in negative ES mode of atRA metabolites generated by incubation with baculovirus-insect cell microsomes expressing CYP3A7 and cytochrome b5 supplemented with recombinant CPR.

