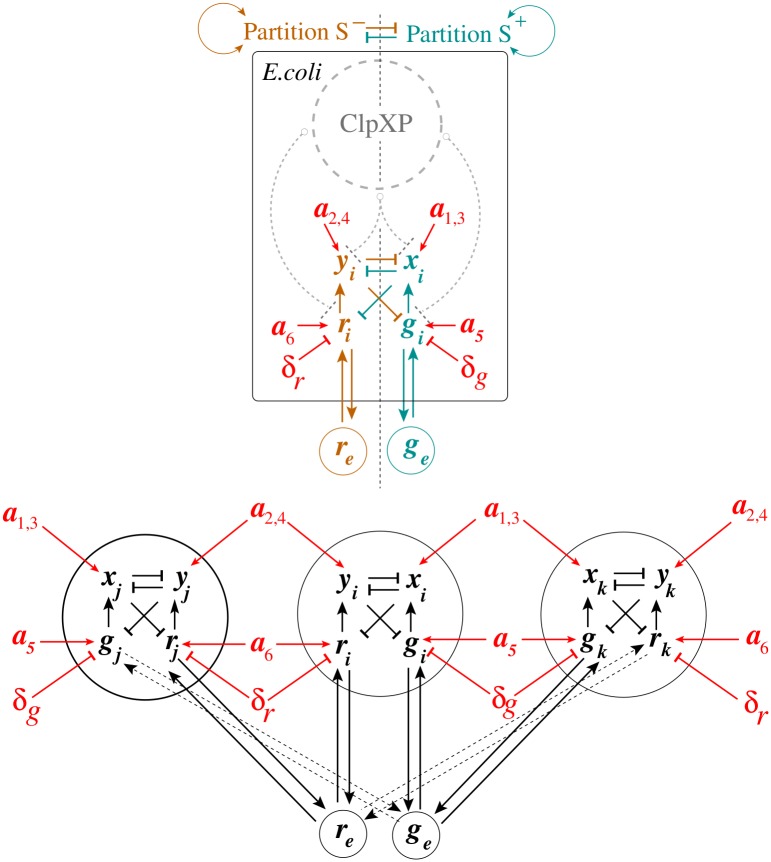
Fig 3. Application of Monotone Systems Theory to the S design.
The top panel presents a monotonicity diagram for a single-cell S design, while the bottom panel represents an example of three identical S toggles interacting via common autoinducers, see the main text for details. In all cases, solid arrows and lines highlighted in red color correspond to monotone parameter dependencies. In the bifurcation analysis, the values of all monotone parameters are varied for all cells simultaneously.

