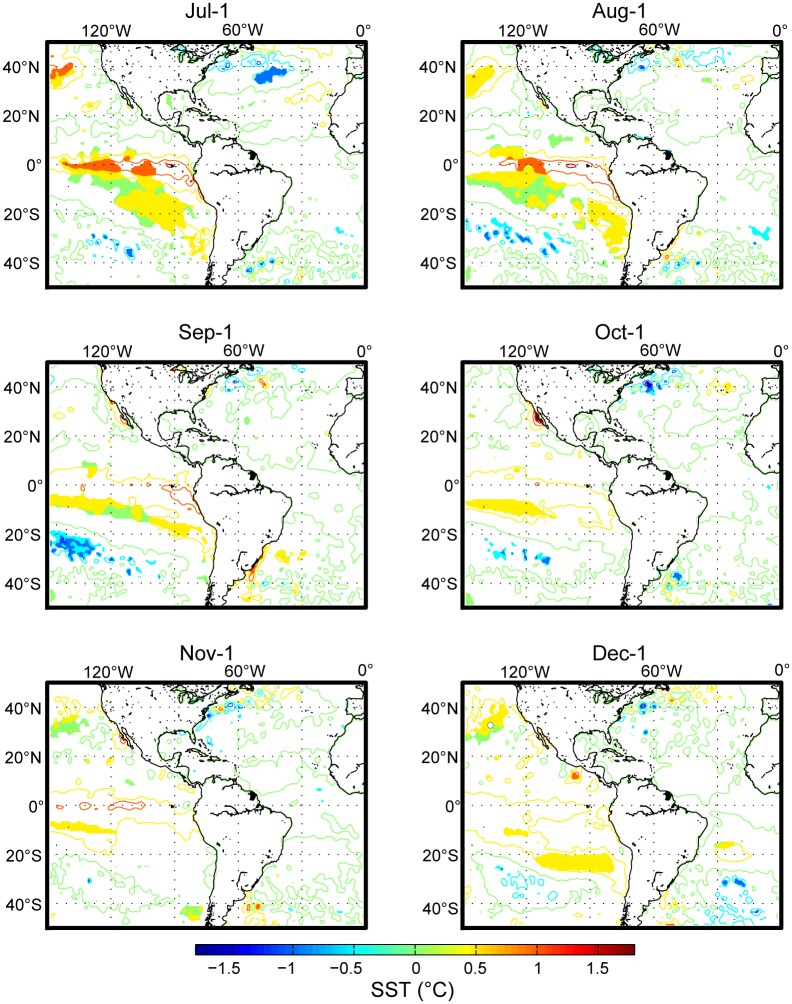
Fig 3. Sea surface temperature conditions that characterized an epidemic year.
A composite analysis was performed by separately averaging the SST data for the years in which the highest (HIGH) and lowest (LOW) DF incidences were recorded in French Guiana. The contours (0.5°C interval) show the HIGH minus the LOW differences in the SST from July to December to illustrate the conditions that characterized a typical epidemic year. Filled-in areas indicate significant differences at the 5% confidence interval that were calculated using Student's t-test.

