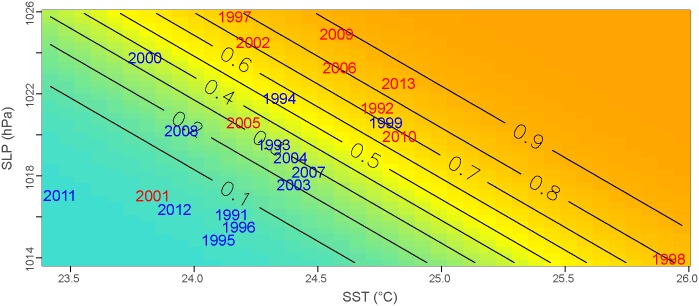
Fig 5. Logistic model probability and observed epidemiologic situations.
The probability (grey lines) of an epidemic occurring in a year according to the July–August mean Equatorial Pacific Ocean (2° N-20°S, 135°W-90°W) SST and the November Azores High (45°N-35°N, 40°W-20°W) SLP values. In red (blue): epidemic (non-epidemic) years observed in French Guiana from 1991–2013.

