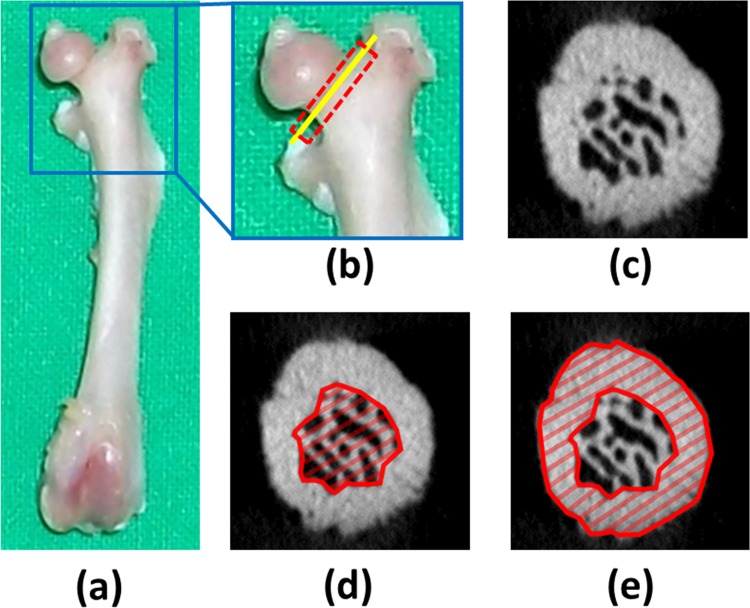
Fig 1.
(a) Picture of the left femur. (b) The region of interest (ROI) in the calculated trabecular bone microarchitecture of the femoral neck is indicated by the dotted red rectangle. The ROI in the calculated cortical bone morphology of the femoral neck is indicated by the solid yellow line. (c) Micro-CT image in the yellow line section of the femoral neck. (d) ROI in the trabecular bone microarchitectural measurement. (e) ROI in the cortical bone morphology measurement.

