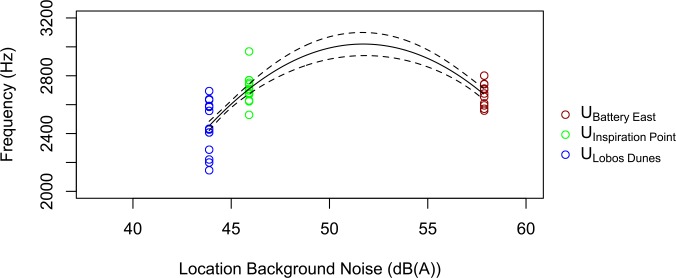
Fig 2. Song minimum frequency is related to background noise levels in the same urban dialect.
Song minimum frequency is on the y-axis and the amplitude of background noise is on the x-axis. The San Francisco dialect was sampled at three urban locations, UBattery East, UInspiration Point, and ULobos Dunes. The solid line represents model average predictions and the dashed line represents the standard error.

