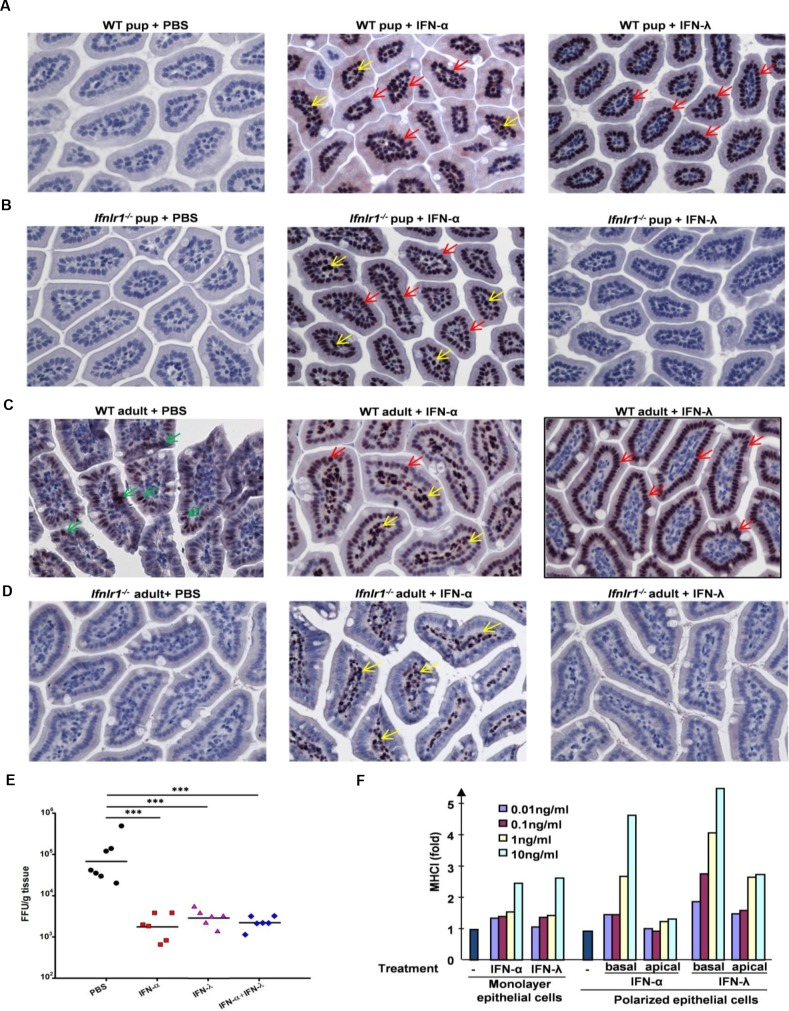
Fig 5. Differential responsiveness of IECs and LPCs to type I and type III IFNs.
(A-C) Representative of immunohistochemical staining of pSTAT1 (pTyr701) in small intestine of eight-day-old suckling (A) C57BL/6J WT or (B) Ifnlr1 -/- mice, or six to eight-week-old (C) C57BL/6J WT mice or (D) Ifnlr1 -/- mice were subcutaneously injected with PBS, human IFN-αA/D (IFN-α; 1μg) or murine IFN-λ2 (IFN-λ; 1μg). Small intestine samples were collected 30 min post injection. Red and yellow arrows indicate nuclear staining of pSTAT1 in IFN-treated IECs and LPCs, respectively. Green arrows indicate low levels of pSTAT1 staining in PBS-treated IECs in adult WT mice. (E) Graph of virus titers on 1 dpi in small intestine of eight-day-old suckling C57BL/6J WT mice subcutaneously injected with PBS, human IFN-αA/D (IFN-α; 1μg) or murine IFN-λ2 (IFN-λ; 1μg), or their combination (1μg of each IFN) 6 h before oral infection with 4x10⁶ FFU RRV. Virus titers were determined by immunohistochemical focus assay and expressed as FFU/g of tissue. (F) Graph of fold increase of MHC class I expression in human SW-1116 cells grown under polarized or regular culture conditions, treated at the apical or basolateral surfaces with various amounts of human IFN-αA/D or IFN-λ1 as indicated for 72 h. One representative experiment out of two is shown.

