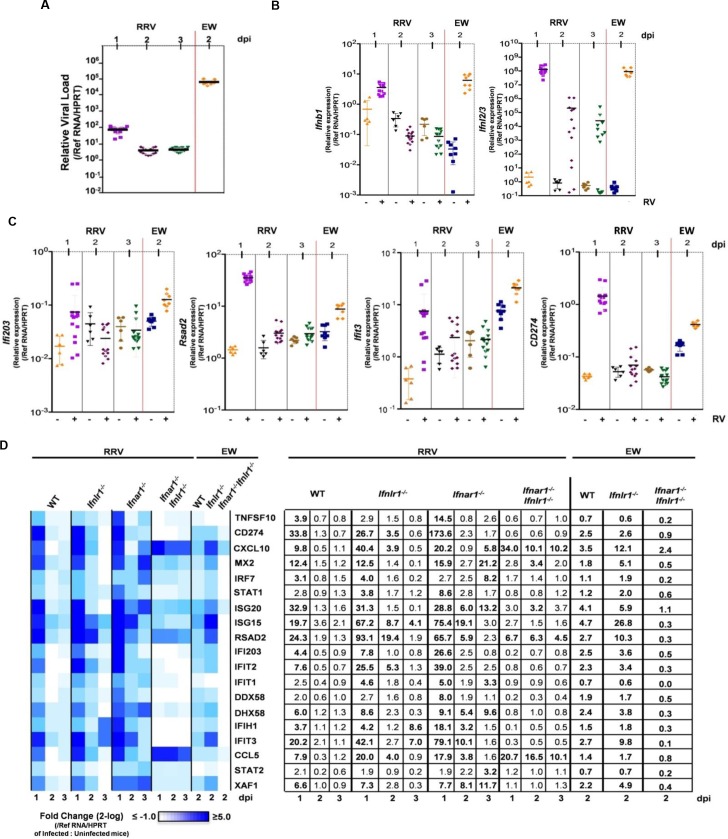
Fig 7. Type I and type III IFNs act redundantly during murine EW-RV and simian RRV infection to establish antiviral programs in small intestine.
(A-C) Graph of quantitative RT-PCR detection of (A) RV levels, (B) IFN expression and (C) expression of indicated ISGs in small intestine of RRV-infected WT mice on 1, 2 and 3 dpi and EW-RV-infected WT mice on 2 dpi. Symbols (A-C) duplicate measures from individual mice. (D) Graph of heat map of gene expression in intestinal samples presented as mean fold change in expression in infected mice relative to that of uninfected mice and shown on a 2-log scale. Transcriptional profiling was performed on small intestine samples from RRV and EW-RV-infected WT and single or double IFN receptor-deficient mice. Numbers in the table represent the mean fold change in gene expression on 1, 2 and 3 dpi for RRV, or on 2 dpi for EW-RV-infected, compared to uninfected litters. Changes above 3.0-fold are shown in bold. (n = 12–24 mice per group for RRV and 4–8 mice per group for EW-RV). Replication data in (A) is reformatted from Figs 2 and 4 for comparative purposes. Symbols (A-D) duplicate measures from individual mice. (n = 12–24 mice per group for RRV and 4–8 mice per group for EW-RV).

