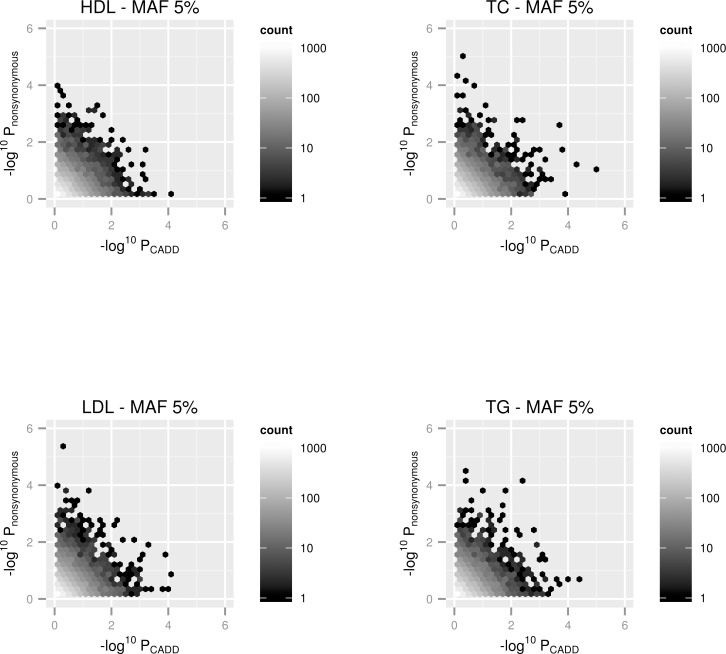
Fig 1. Hexbin plots representing gene-based SKAT analyses for all genes across the genome using a MAF cutoff of 5% with 4 lipid traits.
The x-axis represents the–log10 transformed p-value from the analysis after filtering according to CADD annotations. The y-axis represents the–log10 transformed p-value from the analysis after filtering according to ‘nonsynonymous’ annotations. Only gene regions which had at least 2 variants in them after filtering by both methods were plotted.

