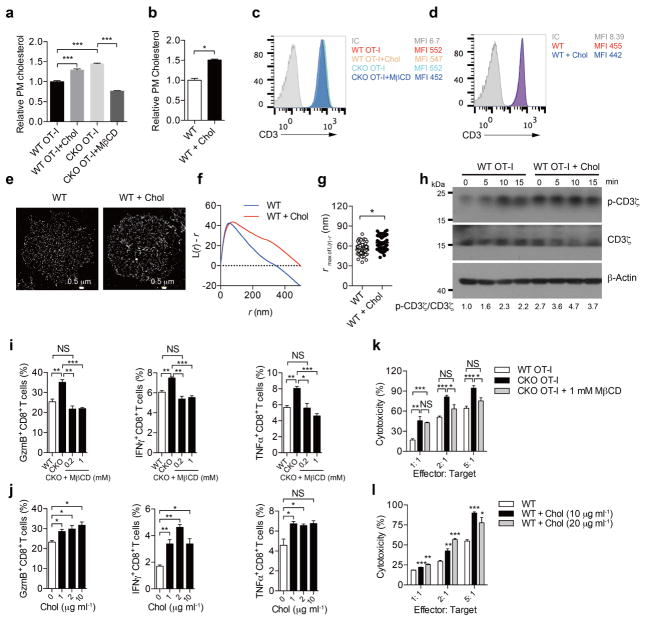
Extended Data Figure 7. Cholesterol level of the plasma membrane directly affects CD8+ T-cell function.
To reduce the cholesterol level of the plasma membrane, CD8+ T cells were treated with MβCD at different doses for 5 min. To increase the cholesterol level, CD8+ T cells were treated with MβCD-coated cholesterol (chol) at different doses for 15 min. a, b, Measurements of plasma membrane cholesterol level of CD8+ T cells by biotinylation-based method. MβCD-coated cholesterol treatment increased whereas MβCD decreased plasma membrane cholesterol. a, Wild-type OT-I CTLs were treated with 10 μg ml−1 MβCD-coated cholesterol, and CKO OT-I CTLs were treated with 1 mM MβCD. WT OT-I, n = 8; CKO OT-I, n = 6. b, Naive wild-type polyclonal CD8+ T cells were treated with 10 μg ml−1 MβCD-coated cholesterol (n = 4). c, d, TCR levels of CD8+ T cells after MβCD or MβCD-coated cholesterol treatment. MβCD treatment reduced whereas MβCD-coated cholesterol treatment did not change the surface TCR level. OT-I CTLs (c) and naive wild-type polyclonal CD8+ T cells (d) were treated as in a and b, respectively. IC, isotype control. e–g, TCR clustering after treatment of naive wild-type CD8+ T cells with 10 μg ml−1 MβCD-coated cholesterol. Super-resolution STORM images of TCR were acquired and analysed as Fig. 3g–i. Increasing plasma membrane cholesterol of CD8+ T cells promoted the clustering of TCR. g, WT, n = 73; WT +chol, n = 62. h, TCR signalling after treatment of wild-type OT-I CTLs with 10 μg ml−1 MβCD-coated cholesterol, measured by immunoblotting. Cells were then stimulated with 2 μg ml−1 anti-CD3 and anti-CD28 antibodies for indicated time at 37 °C. Increasing plasma membrane cholesterol of CD8+ T cells promoted the signalling of TCR. See Supplementary Fig. 1 for gel source data. i, j, Cytokine/granule productions of CD8+ T cells treated with MβCD (i) or MβCD-coated cholesterol (j) (n = 3). Cells were stimulated with 5 μg ml−1 plate-bound anti-CD3 and anti-CD28 antibodies for 24 h at 37 °C. k, l, Cytotoxicity of CD8+ T cells treated with MβCD (k) or MβCD-coated cholesterol (l) (n = 3). CTLs were then incubated with EL-4 cells pulsed with OVA257–264 for 4 h. LDH release was measured to assess cytotoxic efficiency. Data were analysed by unpaired t-test (a, b, i–l) or Mann–Whitney test (g). Error bars denote s.e.m; *P < 0.05; **P < 0.01; ***P < 0.001.

