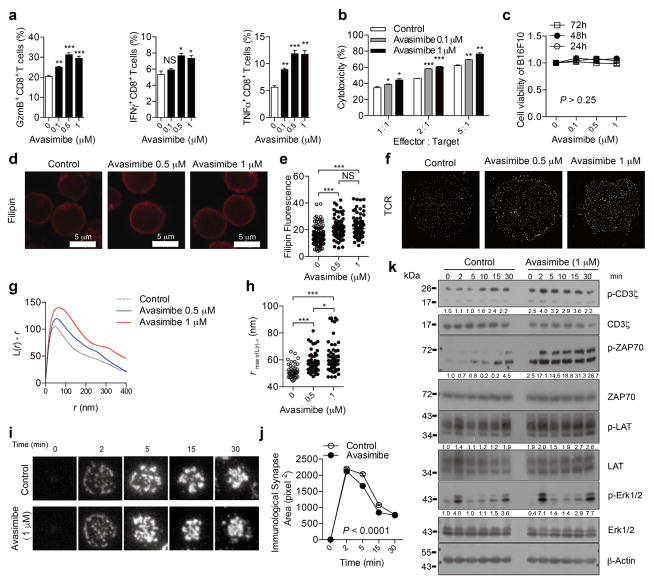
Extended Data Figure 9. Avasimibe treatment leads to enhanced TCR clustering and signalling, as well as more efficient formation of immunological synapse.
a, Cytokine/granule productions of CD8+ T cells after avasimibe treatment (n = 3). The naive cells were pretreated for 6 h with avasimibe or vehicle (DMSO) and then stimulated by 5 μg ml−1 plate-bound anti-CD3 and anti-CD28 antibodies for 24 h. Data were analysed by t-test. b, CTL cytotoxicity after avasimibe treatment measured by the LDH assay (n = 3). OT-I CTLs were pretreated with avasimibe or vehicle for 6 h and then incubated with EL-4 cells pulsed with OVA257–264 peptide for 4 h. Data were analysed by t-test. c, An MTS-based cell viability assay was performed to assess the toxicity of avasimibe to B16F10 cells (n = 6). Data were analysed by one-way ANOVA, and no significant difference was observed. d, e, Filipin III staining to analyse cellular cholesterol distribution in naive CD8+ T cells treated with avasimibe or vehicle. d, Representative images. e, Data were analysed by Mann–Whitney test. 0, n = 217; 0.5, n = 139; 1, n = 133. f–h, Super-resolution STORM images of TCR in naive CD8+ T cells treated with avasimibe or vehicle. f, Representative images. g, Ripley’s K-function was used to analyse TCR molecules distribution. h, The r value at the maximal L(r) − r value of Ripley’s K-function curves, and data were analysed by Mann–Whitney test. 0, n = 41; 0.5, n = 60; 1, n = 66. i, Representative TIRFM images of immunological synapses of CD8+ T cells treated with avasimibe (1 μM) or vehicle for 6 h. Cells were stimulated by PLB-bound anti-CD3 for the indicated time and fixed by 4% PFA before imaging. j, Areas of the immunological synapses (n > 60 cells). The formation and contraction of the immunological synapses of CD8+ T cells treated with avasimibe were more rapid than those treated with vehicle. Data were analysed by two-way ANOVA. k, TCR proximal and downstream signalling was assessed using immunoblotting of protein phosphorylation. OT-I CTLs were treated with 1 μM avasimibe or vehicle for 6 h and then stimulated with 2 μg ml−1 soluble anti-CD3 and anti-CD28 for the indicated time. See Supplementary Fig. 1 for gel source data. Error bars denote s.e.m; *P < 0.05; **P < 0.01; ***P < 0.001.

