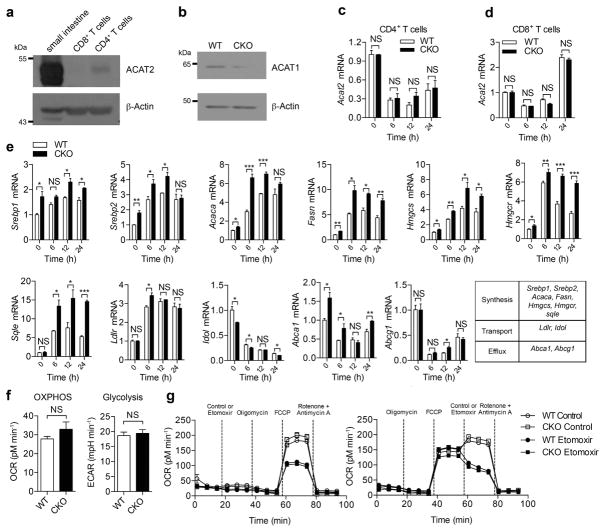
Extended Data Figure 2. ACAT1 deficiency affects the cholesterol metabolism but not the basal energy metabolism of CD8+ T cells.
a, ACAT2 was weakly expressed in mouse CD4+ T cells but was barely detectable in mouse CD8+ T cells. A sample from mouse small intestine was used as a positive control. b, Protein levels of ACAT1 were significantly lower in Acat1CKO (CKO) CD8+ T cells than in wild-type cells, indicating a good knockout efficiency of Acat1 in CD8+ T cells. See Supplementary Fig. 1 for gel source data. c, d, ACAT1 deficiency did not change the transcriptional level of Acat2 in CD4+ and CD8+ T cells of Acat1CKO mice. Cells were stimulated with 5 μg ml−1 plate-bound anti-CD3 and anti-CD28 antibodies for the indicated time (n = 3). e, ACAT1 deficiency resulted in significant enhancement of the transcription levels of cholesterol synthesis genes in both naive and activated cells. Transcription levels of cholesterol transport and efflux genes underwent only modest changes in CKO CD8+ T cells. Naive wild-type or CKO CD8+ T cells were stimulated with 5 μg ml−1 plate-bound anti-CD3 and anti-CD28 for the indicated time (n = 3). f, g, Basal energy metabolism of naive wild-type and CKO CD8+ T cells was measured. No significant difference was observed between wild-type and CKO cells. f, Oxidative phosphorylation was measured by the oxygen consumption rates (OCR) under basal condition, and glycolysis was measured by the extracellular acidification rates (ECAR) under basal condition (n = 5). g, Fatty acid oxidation was measured by the OCR under basal condition and in response to indicated drugs: oligomycin (to block ATP synthesis), FCCP (to uncouple ATP synthesis from the electron transport chain), rotenone and antimycin A (to block complex I and III of the electron transport chain, respectively), and etomoxir (to block mitochondrial fatty acid oxidation). Fatty acid oxidation can be represented by the influence of etomoxir on the OCR. Between wild-type etomoxir and CKO etomoxir: P > 0.05 after FCCP in g (left); P > 0.05 after etomoxir in g (right). Between wild-type and CKO: P > 0.05 after FCCP in g (left): P > 0.05 after control in g (right). No significant difference was observed (n = 3). Data are representative of two (c–e, g) or three (f) independent experiments, and were analysed by unpaired t-test (c–f) or two-way ANOVA followed with Bonferroni’s multiple comparison tests (g). Error bars denote s.e.m; *P < 0.05; **P < 0.01; ***P < 0.001.

