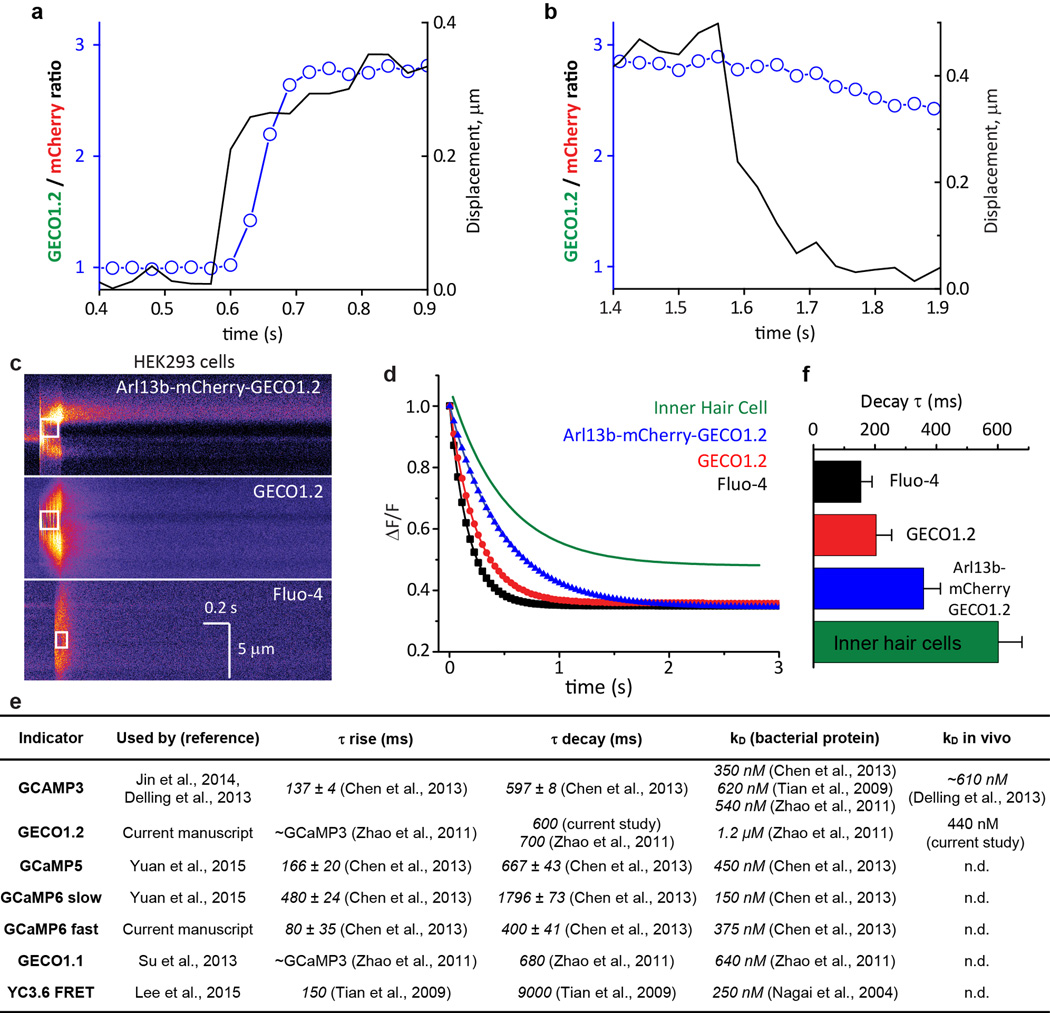
Extended Data Figure 4. GECO1.2 koff for Ca2+ dissociation from GECO1.2, measured in cells.
a, b, Fig. 1g at higher time resolution. F_GECO1.2/F_mCherry ratio (open circles) relative to bundle motion (black line) at the initial deflection, a, and after return to the resting position, b. Bundle deflection preceded the F_GECO1.2/F_mCherry ratio increase by two frames (~60 ms). At the termination of the flow stimulus and return to the resting position, the ratio remained elevated due to the slow decay (τ ~ 0.6 s) of the Ca2+ from GECO1.2. c, Rapid Ca2+ uncaging was used to measure the Ca2+ decay rates for GECO1.2 (not bound to the membrane), Arl13b-mCherry-GECO1.2 (bound to the membrane), and the Fluo-4 control with its established time constant of decay. HEK293 cells were transfected with GECO1.2 or Arl13b-mCherry-GECO1.2 constructs and loaded with caged Ca2+ (NP-EGTA), or loaded with a combination of Fluo4-AM and NP-EGTA. Caged Ca2+ was released by a local 100–200 ms pulse of UV laser illumination (white box); images were acquired in line scan mode (2 ms/horizontal line). Representative of >16 images. d, Representative fitted fluorescence intensity decays of Fluo-4 in HEK293 cells (black), GECO1.2 (red), and Arl13b-mCherry-GECO1.2 (blue), compared to GECO1.2 from Arl13b-mCherry-GECO1.2tg IHCs following deflection (green). e, Table summarizing molecular properties of genetically encoded calcium indicators (GECI’s) used in current and previous reports describing ciliary Ca2+ signaling14–17,36,42–45. f, Average decay rates, τ, for indicators in c, d. Fluo-4: τ = 154 ± 36 ms (n=16); GECO1.2 in HEK293 cells: τ = 203 ± 50 ms (n=19); Arl13b-mCherry-GECO1.2 in HEK293 cells: τ = 358 ± 55 ms (n=16); Arl13b-mCherry-GECO1.2 in IHC stereocilia: τ = 601 ± 70 ms (n=10). Averages ± S.D.

