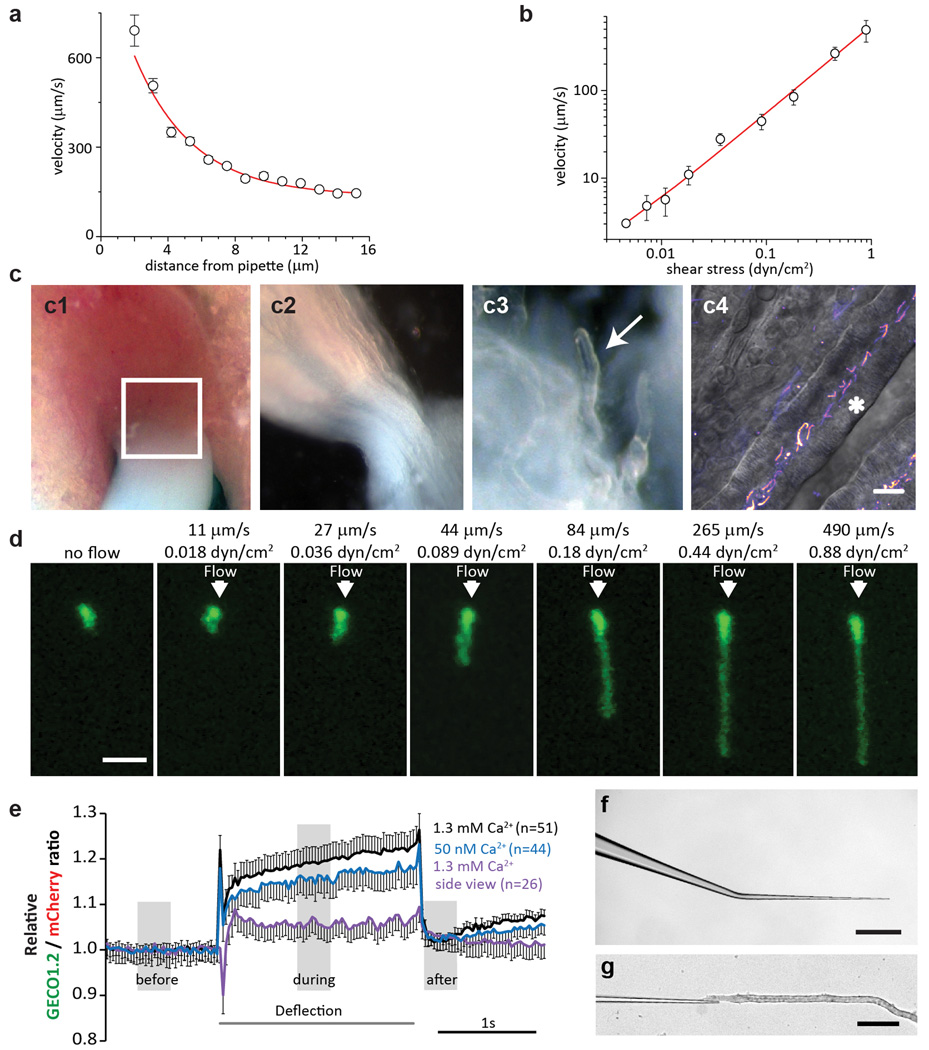
Extended Data Figure 5. Kidney tubule dissection and flow velocity calibration.
a, Calibration of the fluid velocity exiting the stimulus pipette vs. distance from the mouth of the pipette (3-µm pipette, 6.4 mm Hg pressure step). The pipette was positioned ~4–6 µm from the cilium, delivering a flow velocity of 250–300 µm/s (n=5). b, Velocity measured at the tip of the cilium and calculated shear stress at the plasma membrane (n=6). c, Microdissection of kidney tubules. c1: Coronal section of P15 kidney; white box indicates the microdissected area. c2: Area from c1 following microdissection. c3: Small bundle of tubules; individual tubules gently separated from the bundle (arrow). c4: Tubules with thick walls and fluorescent cilia (asterisk) used for experiments. Scale bar, 5 µm. Images representative of >6 preparations. d, Maximum intensity z-projection of mIMCD primary cilia deflected in the flow chamber using defined fluid velocities. Scale bar, 3 µm; representative of 14 cilia each with 7 z-stacks containing 12 frames. e, Relative ratio changes in primary mIMCD primary cilia during deflection, 3 experimental conditions. Black and blue lines represent the averaged normalized ratio changes for top views of cilia deflection in 1.3 mM and 50 nM [Ca2+], respectively. The increase in ratio upon cilia deflection is comparable between high and low external [Ca2+], suggesting that the ratio change did not result from Ca2+ entry (Fig. 3h for p values). In addition, the return to baseline with cilium movement was much faster than the Ca2+ indicator response time, providing further evidence that it is a motion artifact. Such fast responses were not observed in the bona fide Ca2+ entry into IHC stereocilia (Fig. 2a, Extended Data 4b, d). Purple line represents the average normalized ratio changes for side-imaged cilia deflections in the presence of 1.3 mM [Ca2+]. Ratio changes were negligible in side views, as the motion artifact (light path length change upon motion) is small. The positive slope seen in top views results from differential dye bleach, faster for mCherry than GECO1.2. Bleaching has a much more pronounced effect in top views, probably from the change in geometry, contribution from underlying autofluorescence, and relative light exposure upon bending. f, Micropipette used for cilia deflection inside the kidney tubules. Scale bar, 0.5 mm. g, Insertion of micropipette into the tubule. Scale bar, 100 µm. All error bars ± SEM.

