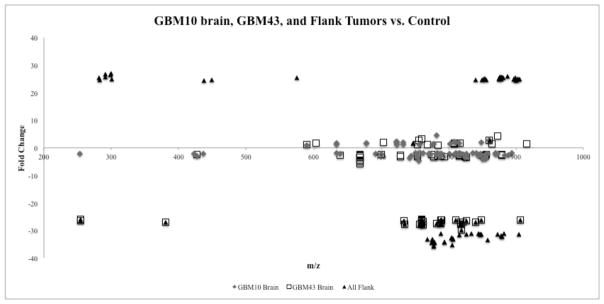
Fig. 3.
m/z and fold effect comparison of each tissue type. The m/z and fold effect range of differentially expressed lipids between brain and flank tumors are indicated. In general, lipidomic profiles of the flank tumors of GBM expressed a greater fold change (between −35and −20) when compared to the brain tumor profiles. m/z value of the identified lipids were mostly concentrated in the range of 750 and 900.

