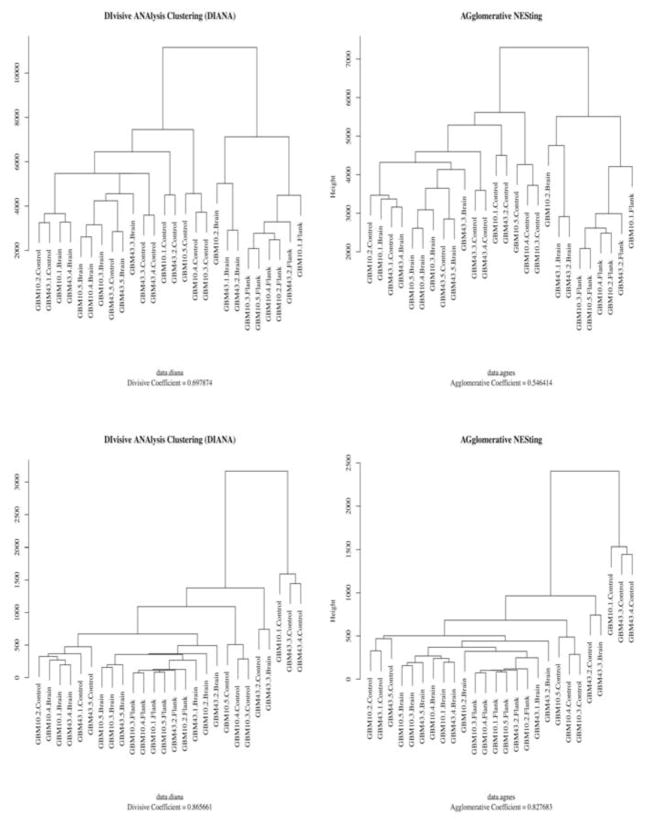
Fig. 5.
Hierarchical clustering output of xenograft tissues. Two different hierarchical clustering methods (DIANA and AGNES) were utilized to validate the data analysis method. Clusters were created by m/z values and peak intensity from the data generated by MzMine2. Top two graphs were generated from the positive ion mode data and bottom two graphs were generated from the negative ion mode data.

