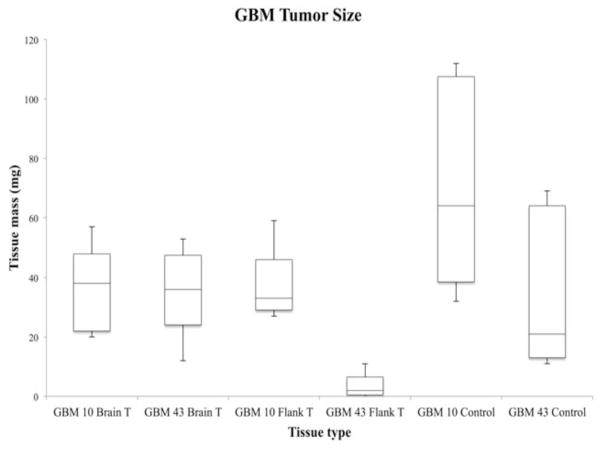
Fig. 6.
Tumor size comparison between different GBM tumors and control brain tissue. The box plot represents the tumor size of different tissue types. The mass of GBM10 brain tumors (n=5), GBM43 brain tumors (n=5), and GBM10 (n=5) tumors were similar. However, the size of GBM43 flank tumors (n=5) from the xenograft model was significantly smaller compared to other tumor tissues. One of GBM43 flank tumor did not grow, which counted as 0mg. Four tumors were harvested for the lipid extraction. However, three among these four tumors were too small for the extraction.

