
Graph 2.
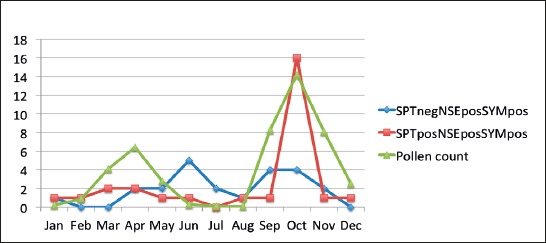
Correlation between number of symptomatic patients in SPT negative, NSE positive and SPT positive and NSE positive groups with monthly pollen count.
Official websites use .gov
A
.gov website belongs to an official
government organization in the United States.
Secure .gov websites use HTTPS
A lock (
) or https:// means you've safely
connected to the .gov website. Share sensitive
information only on official, secure websites.
Correlation between number of symptomatic patients in SPT negative, NSE positive and SPT positive and NSE positive groups with monthly pollen count.