. 2016 Apr 29;5:e13254. doi: 10.7554/eLife.13254

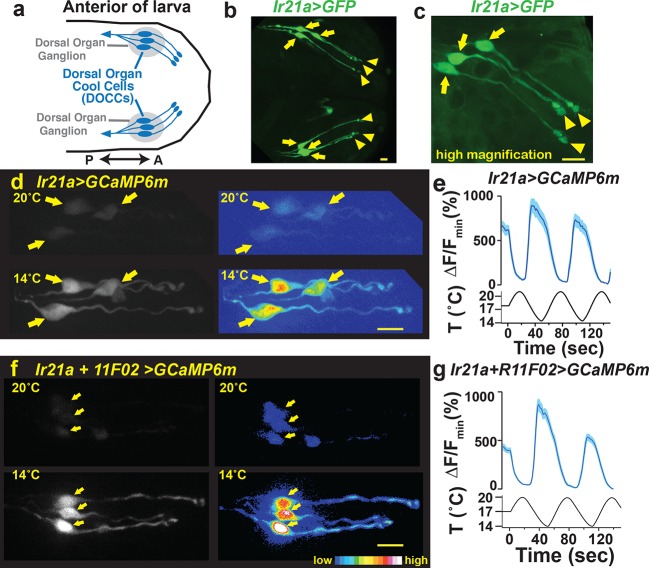
Figure 1. Dorsal Organ Cool Cells (DOCCs) express Ir21a-Gal4.

(a) First/second instar larval anterior. Each Dorsal Organ Ganglion (grey) contains three DOCCs (blue). Anterior-Posterior axis denoted by double-headed arrow. (b,c) Ir21a-Gal4;UAS-GFP (Ir21a>GFP) labels larval DOCCs. Arrows denote cell bodies and arrowheads dendritic bulbs. (d) Temperature responses of Ir21a-Gal4;UAS-GCaMP6m-labeled DOCCs. Left panels, raw images; right panels, colors reflect fluorescence intensity. Arrows denote cell bodies. (e) Fluorescence quantified as percent change in fluorescence intensity compared to minimum intensity. n=22 cells (from 6 animals). (f,g) Temperature-responses of Ir21a-Gal4;R11F02-Gal4;UAS-GCaMP6m-labeled DOCCs. n=26 (7). Scale bars, 10 microns. Traces, average +/- SEM. Figure 1—figure supplement 1 provides an example of the 3-D imaging stacks used for calcium imaging data acquisition.

DOI: http://dx.doi.org/10.7554/eLife.13254.003

Figure 1.

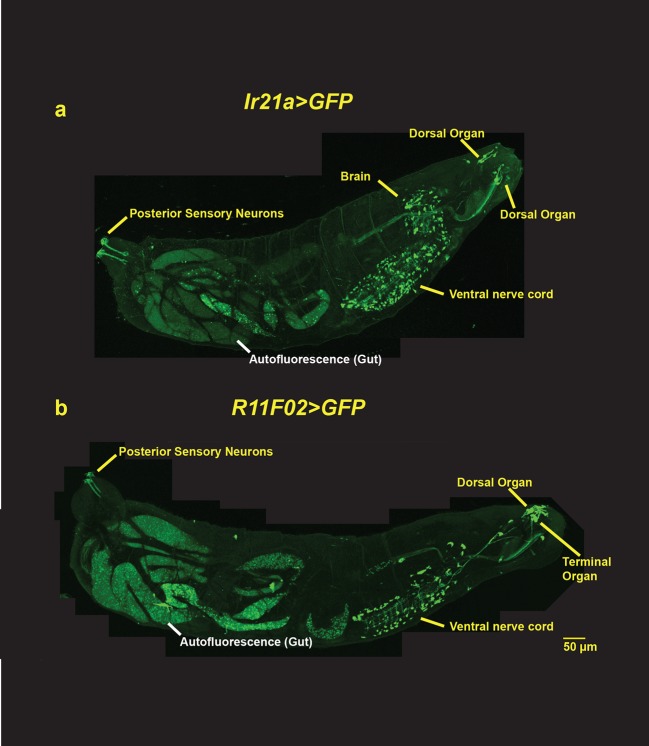
Figure 1—figure supplement 1. Larval-wide expression patterns of Ir21a-Gal4 and R11F02-Gal4.

Figure 1—figure supplement 1.

(a) Ir21a-Gal4; UAS-GFP expression. (b) R11F02-Gal4; UAS-GFP expression. In addition to expression in the Dorsal Organ, both Gal4s exhibit expression in ~100 cells in the brain and ventral ganglion, neurons along the larval body wall and in the tail. R11F02-Gal4 is also expressed by sensory neurons in the Terminal Organ.
Figure 1—figure supplement 2. Calcium-imaging data are obtained as a three-dimensional imaging stack.

Figure 1—figure supplement 2.

(a) Dimensions of imaging volume. DOCCs depicted in blue. (b) Maximum intensity projections used for visualizing fluorescence intensity. (c) Representative image of maximum intensity projections of Ir21a>GCaMP6m-labeled DOCCs. DOCC cell bodies remain within imaging field throughout.