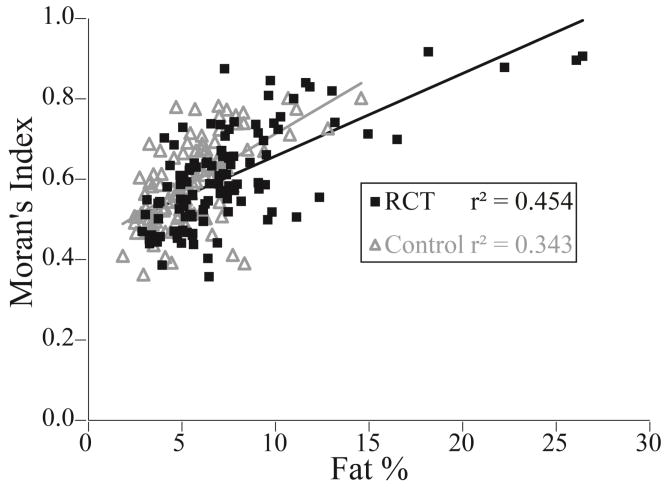
Figure 7.
Moran’s Index versus fat% for each section of all muscles for the rotator cuff tear (RCT) subjects (black) (p<0.001) and control (gray) subjects (p<0.001). Poor fit between the two measures reveals that volumetric distribution and spatial clustering provide different information regarding the spatial characteristics of intramuscular fat.

