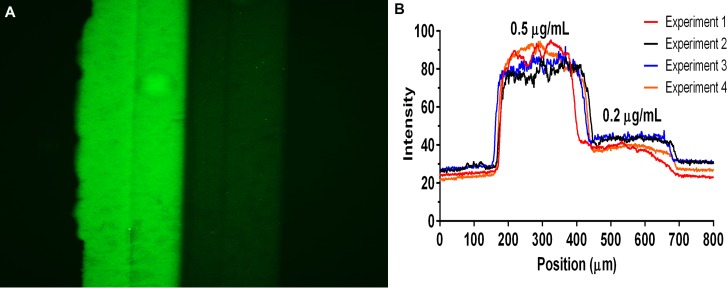
FIG. 8.
Immunofluorescence image of P-selectin Step Patterns. (a) A representative fluorescence image of a step pattern of mP-selectin formed by perfusing two different concentrations of mP-selectin (0.2 and 0.5 μg/ml) through a Y-shaped microfluidic device (main channel cross-section 500 μm × 50 μm) for 15 min at 16.0 dyn/cm2. (b) Fluorescence intensity line profiles of 4 different step patterns.

