Fig. 4.

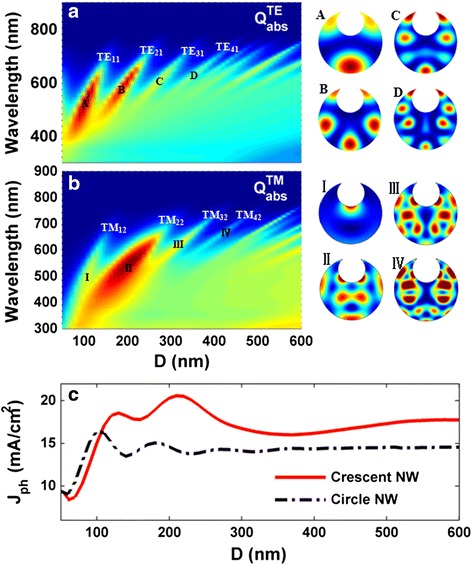
Absorption spectra and electric field patterns. Absorption spectrum (Q abs) versus D under TE (a) and TM (b) incidences; c photocurrent density (J ph) versus D. The electric field patterns of the resonant modes are inserted into the figure

Absorption spectra and electric field patterns. Absorption spectrum (Q abs) versus D under TE (a) and TM (b) incidences; c photocurrent density (J ph) versus D. The electric field patterns of the resonant modes are inserted into the figure