Fig. 3.

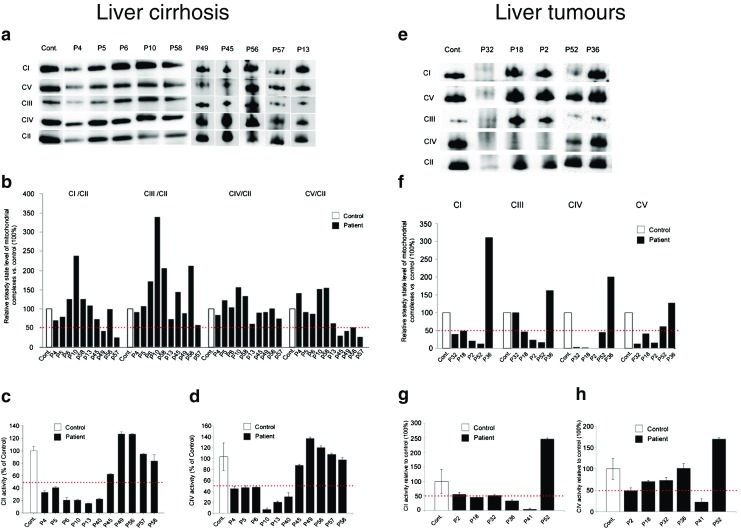
BN PAGE and measurement of enzyme activities in cirrhosis and liver tumours. Liver cirrhosis. a Mitochondrial complexes isolated from control and cirrhosis patients’ liver were separated using blue native gel electrophoresis on gradient Bis-Tris acrylamide gels. b Quantification of respiratory complexes was carried out with band densitometry. Graphs represent the level of complexes relative to the control samples. Band intensities were normalised to complex II. Red dotted line indicates 50 % of the control samples. c Complex II activity. d Complex IV activity. Error bars represent standard deviation. Liver tumours. e Mitochondrial complexes isolated from control and tumour patients’ liver were separated using blue native gel electrophoresis on gradient Bis-Tris acrylamide gels. f Quantification of respiratory complexes was carried out with band densitometry. Graphs represent the level of complexes relative to the control samples (100 %). Band intensities were normalised to complex II. Red dotted line indicates 50 % of the control samples. g Complex II activity. h Complex IV activity. Error bars represent standard deviation
