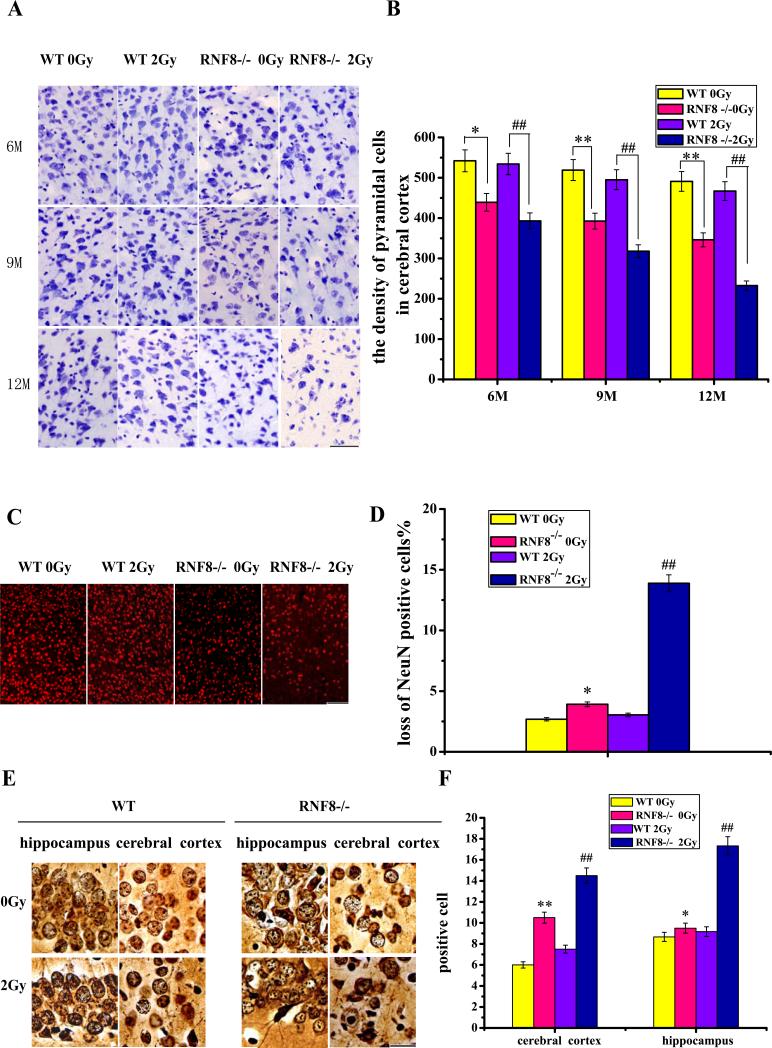
Figure 5. Neuron lost in the RNF8-deficient mice.
(A) Plot of pyramidal cells in the cerebral cortices of 6-, 9- and 12-month-old WT and RNF8−/− mice. Transverse brain slices stained with CV. Scale bar, 50 μm. (B) Bar graph shows the density of pyramidal cells in the cerebral cortices of WT and RNF8−/− mice with or without 2-Gy IR treatment. (C) Sections from 12-month-old WT and RNF8−/− mice were stained with NeuN to quantify the neuronal density. Scale bar, 100 μm. (D) The percentages of neuronal loss in the cortices of 12-month-old WT and RNF8−/− mice were calculated. (E) Plot of the silver-stained cells in the cerebral cortex and hippocampus. Scale bar, 20 μm. (F) Bar graph showing the density of abnormal cells in the cerebral cortex and hippocampus. The values are the means±SD of 6 mice. ** represents P<0.01 vs WT 0 Gy. ## represents P<0.01 vs WT 2 Gy. * represents P<0.05 vs WT 0 Gy.

