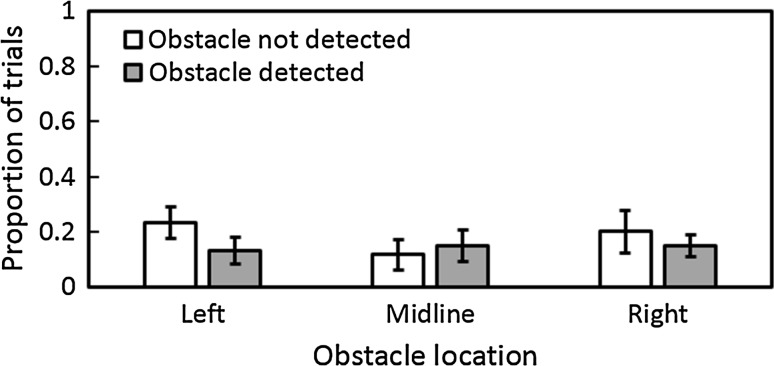
Fig. 2.
Proportion of obstacle-present trials for which collisions occurred for each obstacle location under auditory guidance. Open and grey bars show the proportions of trials where the obstacle was either not detected or detected prior to collision, respectively. In this and subsequent figures, error bars represent ±1 SE

