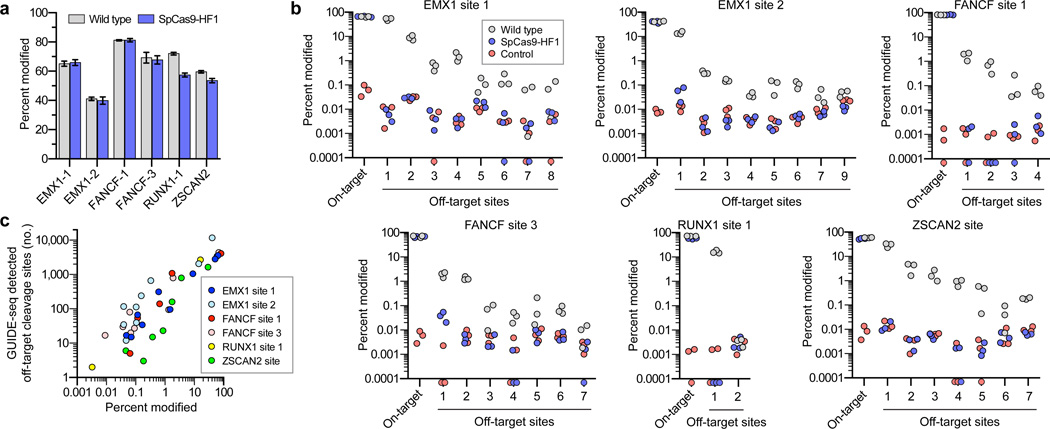
Figure 3. Validation of SpCas9-HF1 specificity improvements by deep sequencing of off-target sites identified by GUIDE-seq.
a, Mean on-target percent modification for wild-type SpCas9 and SpCas9-HF1 with six sgRNAs from Fig. 2. Error bars represent s.e.m. for n = 3. b, Percent modification of on-target and GUIDE-seq detected off-target sites with indel mutations. Triplicate experiments are plotted for wild-type SpCas9, SpCas9-HF1, and a negative control; off-target sites are numbered as indicated in Fig. 2a. Filled circles below the x-axis represent replicates for which no insertion or deletion mutations were observed (Supplementary Table 4). Hypothesis testing using a one-sided Fisher exact test with pooled read counts found significant differences (p < 0.05 after adjusting for multiple comparisons using the Benjamini-Hochberg method) for comparisons between SpCas9-HF1 and the control condition only at EMX1-1 off-target 1 and FANCF-3 off-target 1. Significant differences were also found between wild-type SpCas9 and SpCas9-HF1 at all off-target sites, and between wild-type SpCas9 and the control condition at all off-target sites except RUNX1-1 off-target 2. c, Scatter plot of the correlation between GUIDE-seq read counts (from Fig. 2a) and mean percent modification determined by deep sequencing at on- and off-target cleavage sites with wild-type SpCas9.

