
Figure 1. Development of iTreg and Th17 cells during experimental colitis in Rag1−/− C57BL/6 and Rag1−/−BALB/c mice.
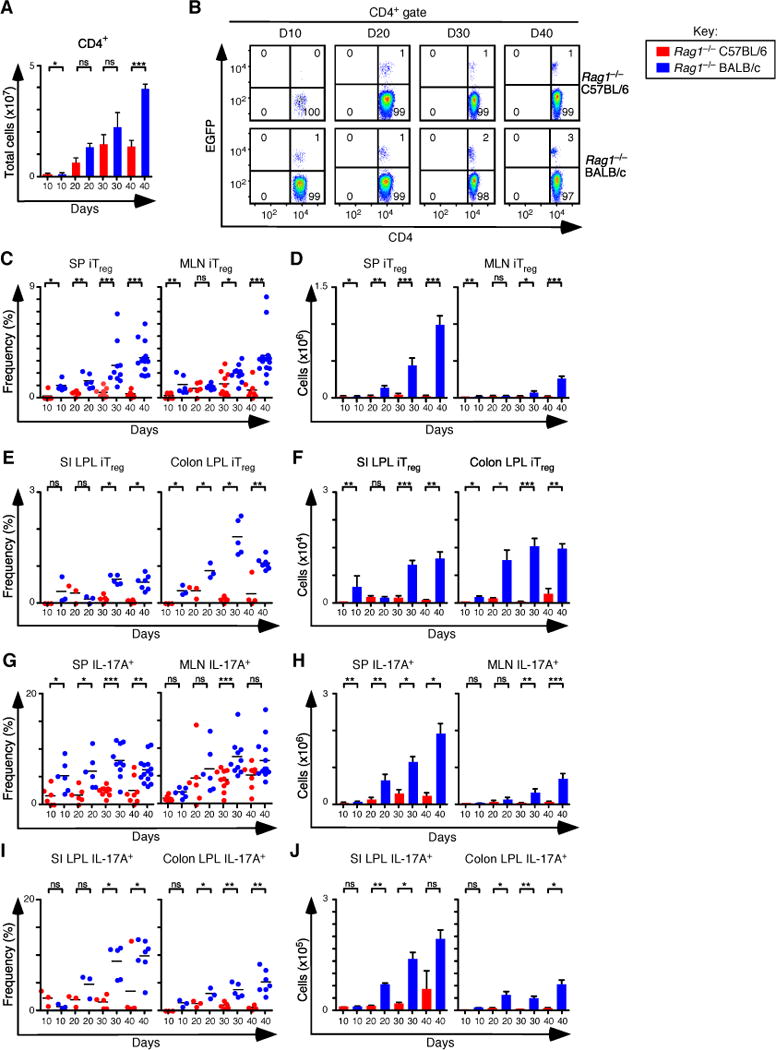
(A) Total number of CD4+ T cells recovered from spleen (SP) and mesenteric lymph nodes (MLN) of Rag1−/− C57BL/6 and Rag1−/− BALB/c at days 10 (n=6 for both), 20 (n=6 for both), 30 (n=10 for both), and 40 (n=8 Rag1−/− C57BL/6, and n=14 Rag1−/− BALB/c) after adoptive transfer of naïve T cells from Foxp3EGFP mice. (B) Representative flow cytometry analysis of CD4 and EGFP (Foxp3) expression to assess the frequency of iTreg cells in MLN for each group. Numbers in quadrants are averages. (C–D) Frequency (C) and number (D) of iTreg cells that develop in SP and MLN. (E–F) Frequency (E) and number (F) of iTreg cells that develop in small intestine (SI) and colon lamina propria at days 10 (n=3 for both), 20 (n=3 for both), 30 (n=5 for both), and 40 (n=4 for Rag1−/− C57BL/6 and n=7 for Rag1−/− BALB/c. (G–H) Frequency (G) and number (H) of Th17 cells that develop in SP and MLN. (I–J) Frequency (I) and number (J) of Th17 cells that develop in SI and colon lamina propria. Each symbol represents an individual mouse, and small horizontal lines represent the mean. Data are representative of 2–3 independent experiments, 2–7 mice per experiment. *p< 0.05, **p< 0.005, ***p<0.0005 and ns, not statistically different; Mann- Whitney test or t-test.