
Figure 5. Pre-Treatment of Rag1−/−C57BL/6 mice with M2a macrophages boosts iTreg-Th17 cell axis development in the small intestine and colon.
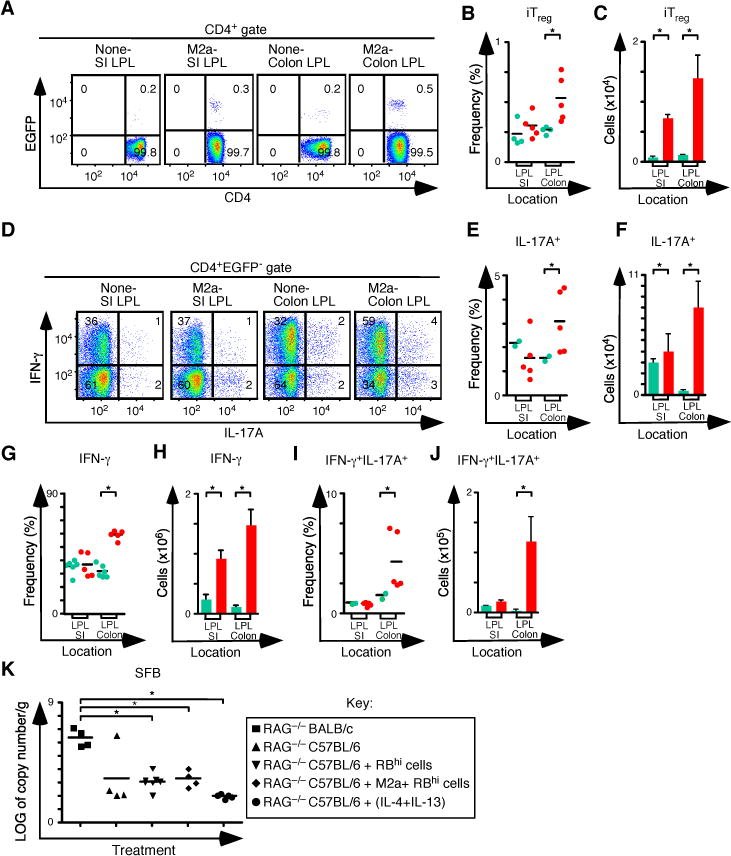
(A) Representative flow cytometry analysis of CD4 and EGFP (Foxp3) expression to assess the frequency of iTreg cells in SI and colon lamina propria for each group. Numbers in quadrants represent the average. (B–C) Frequency (B) and number (C) of iTreg cells in the SI and colon (None n=4 and M2a n=5). (D) Representative flow cytometry analysis of IL-17A and IFN-γ expression to assess the frequency of IFN-γ+, IL-17A+ and IFN-γ+IL-17A+ T cells in MLN for each group. Numbers in quadrants are averages. (E–F) Frequency (E) and number (F) of CD4+ IL-17A+ T cells in the SP and MLN for each group. (G–H) Frequency (G) and number (H) of CD4+ IFN-γ+ T cells in the SP and MLN for each group. (I–J) Frequency (I) and number (J) of CD4+ IFN-γ+ IL-17A+ T cells in the SP and MLN for each group. (K) Log of copy number/g of SFB for each group. Each symbol represents a mouse, and small horizontal bars represent the mean. Data are from 2–3 independent experiments, 1–2 mice per experiment. *p< 0.05; Mann- Whitney test.