
Figure 6. M2a macrophages improve the treatment of colitis with nTreg cells.
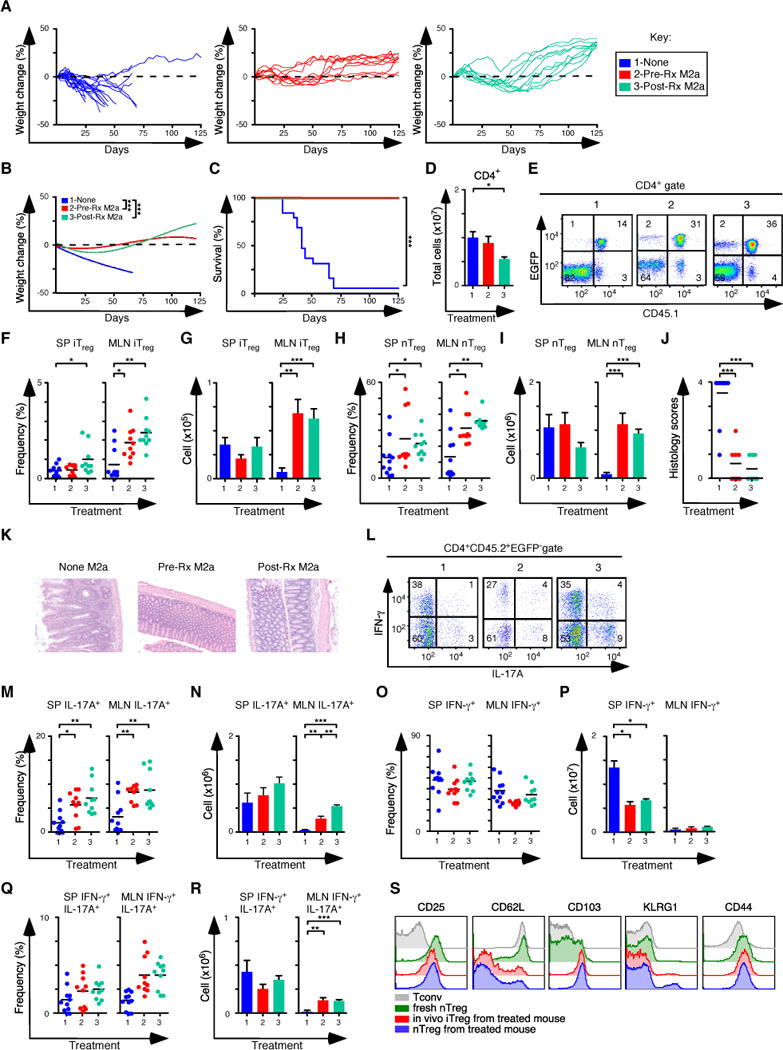
(A, B) Weight change analysis of mice not pre-treated (None), pre-treated (Pre-Rx M2a) or treated (Post-Rx M2a) with M2a macrophages at day 30 after establishment of colitis (None n=12; Pre-Rx n=10; Post-Rx M2a n=10). Note that all groups also received nTreg cells transfers on d31. (C) Kaplan-Meier survival curves of the mice in A. (D) Quantification of donor CD4+ T cells from SP and MLN for each experimental condition in A. (E) Representative flow cytometry analysis of CD45.1 and EGFP (Foxp3) expression to assess the frequency of in situ iTreg (CD45.1− EGFP+) and nTreg (CD45.1+ EGFP+) cells in MLN for each group. Numbers in quadrants are averages. (f–G) Frequency (F) and number (G) of iTreg cells in the SP and MLN. (H–I) Frequency (H) and number (I) of nTreg cells in the SP and MLN. (J–K) Colitis scores (J) and representative H&E stained sections (K) from mice where tissues were taken for histology (None M2a n=11; Pre-Rx M2a n=10; Post-Rx M2a n=10). (l) Representative flow cytometry analysis of IL-17A and IFN-γ expression to assess the frequency of IFN-γ+, IL-17A+ and IFN-γ+IL-17A+ cells in MLN for each group. Numbers in quadrants are averages. (M–N) Frequency (M) and number (N) of CD4+ IL-17A+ T cells in the SP and MLN for each group. (O–P) Frequency (O) and number (P) of CD4+ IFN-γ+ T cells in the SP and MLN for each group. (Q–R) Frequency (Q) and number (R) of CD4+ IFN-γ+ IL-17A+ T cells in the SP and MLN for each group. (S) Representative histograms comparing the expression levels of several proteins associated with Treg function. Tconv cells and nTreg cells were isolated from naïve mice, while in vivo derived iTreg cells and nTreg cells were isolated from mice treated with M2a + nTreg cells. Each symbol represents a mouse and small horizontal bars represent means. Data are from 2–6 independent experiments, 1–5 mice per experiment. *p< 0.05, **p<0.005, ***p<0.0005; Mann- Whitney test.