
Figure 7. M2a macrophages enhance the stability of iTreg cells.
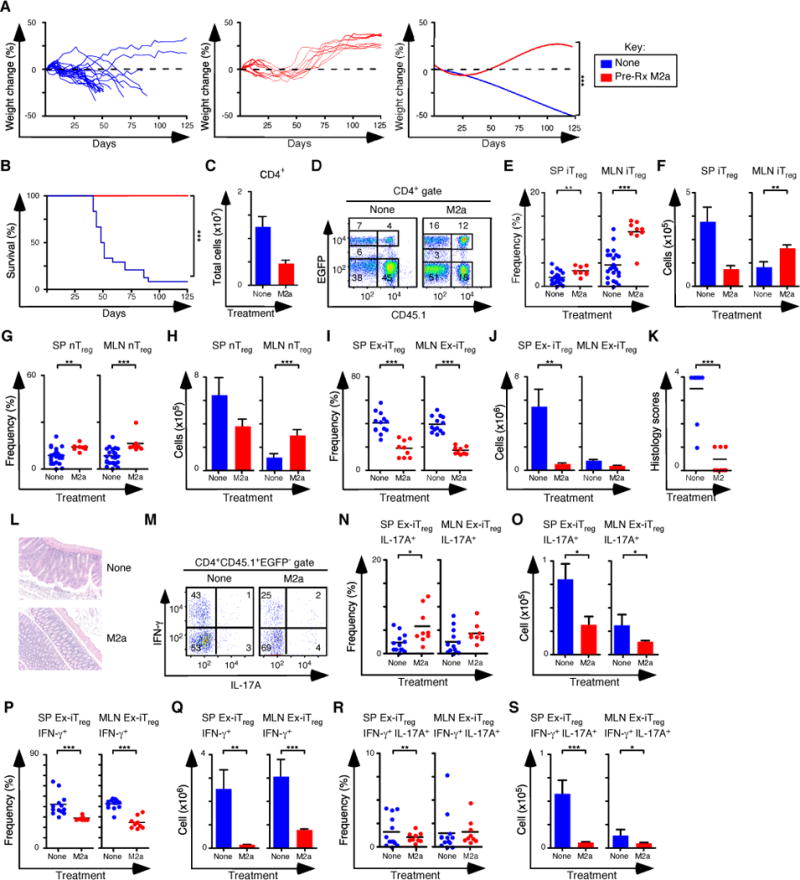
(A) Weight change analysis of mice not pre-treated or pre-treated M2a macrophages followed by colitis induction with naïve CD4+ T cells from rescued Foxp3ΔEGFP mice. All mice were treated with nTreg cells and in vitro derived iTreg cells (None n=24, M2a n=9). (B) Kaplan-Meier survival curves of mice not pre-treated or pre-treated with M2a macrophages (None n=24, M2a n=9). (C) Quantification of donor CD4+ T cells from SP and MLN for each pre-condition treatment. (D) Flow cytometry analysis of CD45.1 and EGFP (Foxp3) expression to assess the frequency of nTreg (CD45.1−EGFP+) and in vitro iTreg (CD45.1+EGFP+) cells in MLN for each group. Numbers in quadrants are averages. (E–F) Frequency (E) and number (F) of iTreg cells in the SP and MLN. (G–H) Frequency (G) and number (H) of nTreg cells in the SP and MLN. (I–J) Frequency (I) and number (J) of ex-iTreg cells in the SP and MLN. (K–L) Colitis scores (K) and representative H&E stained sections (L) from mice where tissue was taken for histology (None n=10, M2a n=9). (M) Representative flow cytometry analysis of IL-17A and IFN-γ expression to assess the frequency of IFN-γ+, IL-17A+ and IFN-γ+ IL-17A+ ex-iTreg cells from the MLN for each group. Numbers in quadrants are averages. (N–O) Frequency (N) and number (O) of IL-17A+ ex-iTreg cells in the SP and MLN for each group. (P–Q) Frequency (P) and number (Q) of IFN-γ+ ex-iTreg cells in the SP and MLN for each group. (R–S) Frequency (R) and number (S) of IFN-γ+ IL-17A+ ex-iTreg cells in the SP and MLN for each group. Each symbol represents a mouse, and small horizontal bars represent the mean. Data are from 2–12 independent experiments, 1–5 mice per experiment. *p< 0.05, **p<0.005, ***p<0.0005; Mann- Whitney test.