
Fig. 1.
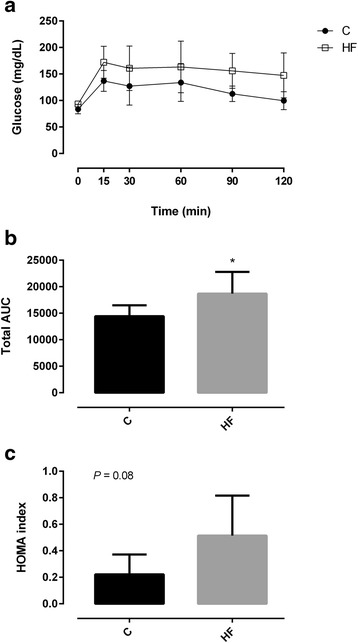
Glycaemic response during oral glucose tolerance test (a), total area under the curve (AUC) (b) and homeostasis model assessment (HOMA) (c) of Wistar rats after 7 weeks of feeding either with standard (St) or high-fat (HF) diet. HOMA was calculated using the formula: fasting glucose (mg/dL) × fasting insulin (ng/mL)/405. Data are presented as mean ± SEM (n = 6 rats per group). * P < 0.05 vs respective St diet group