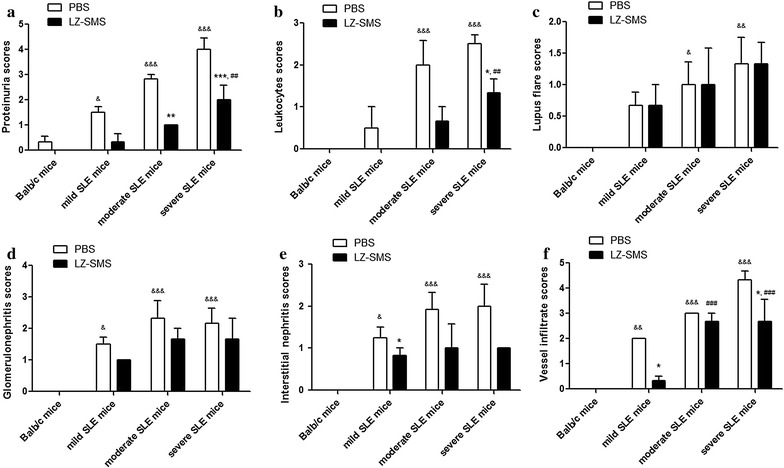
Fig. 1.

Clinical characteristics of MRL/lpr mice with LZ–SMS or PBS treatment. The results of each score system of signs a proteinuria, b leukocyturia, c lupus flare, d glomerulonephritis, e interstitial nephritis and f vessels infiltration are presented as bar charts showing the arithmetic mean plus SD. * <0.05, **P < 0.01, ***P < 0.001, PBS- vs. LZ–SMS-treated MRL/lpr mice; & P < 0.05, && P < 0.01, &&& P < 0.001, Balb/c control mice vs. PBS-treated MRL/lpr mice; ## P < 0.01, ### P < 0.001, Balb/c control mice vs. LZ–SMS-treated MRL/lpr mice (n = 5 in each group)
