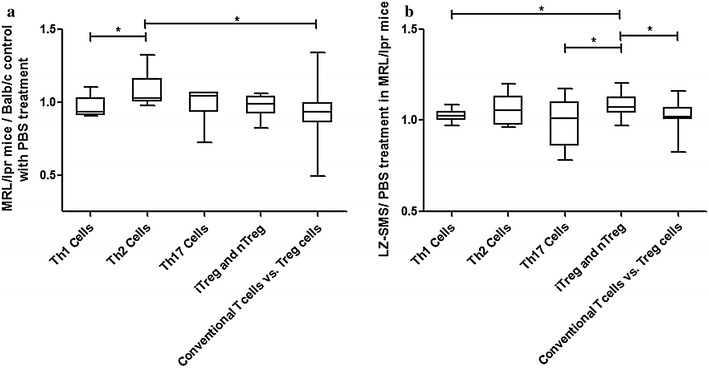
Fig. 4.

RT2 profiler PCR array of mouse Th cell differentiation. The results of gene expressions of Th1 cells, Th2 cells, iTreg and nTreg, Th17 cells and “conventional Th vs. Treg cells” in a PBS-treated MRL/lpr vs. Balb/c mice (in ratio) and b LZ–SMS-treated vs. PBS-treated MRL/lpr mice (in ratio) are presented as box-and-whisker plots with the median (IQR). Mann–Whitney U test was used to assess the differences of mRNA expression among different genes of Th cells. * P < 0.05
