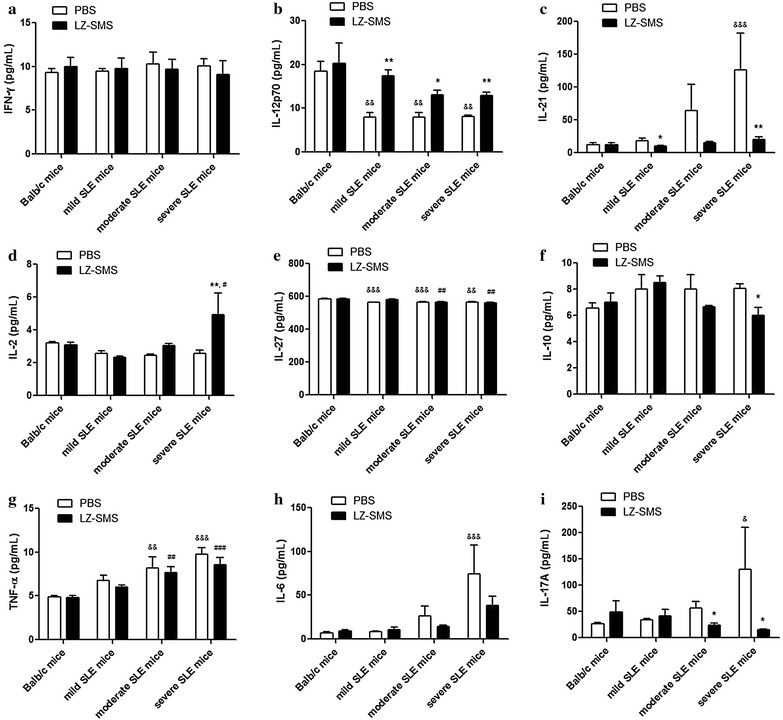
Fig. 6.

Plasma concentrations of cytokines of MRL/lpr and Balb/c mice treated with LZ–SMS or PBS. Bar charts show the arithmetic mean values of the plasma concentrations of a IFN-γ, b IL-12P70, c IL-21, d IL-2, e IL-27, f IL-10, g TNF-α, h IL-6 and (i) IL-17A. *P < 0.05, **P < 0.01, LZ–SMS vs. PBS treatment; && P < 0.01, &&& P < 0.001, Balb/c control mice vs. PBS-treated MRL/lpr mice; # P < 0.05, ## P < 0.01, ### P < 0.001, Balb/c control mice vs. LZ–SMS-treated MRL/lpr mice (n = 5 in each group)
