Fig. 3.

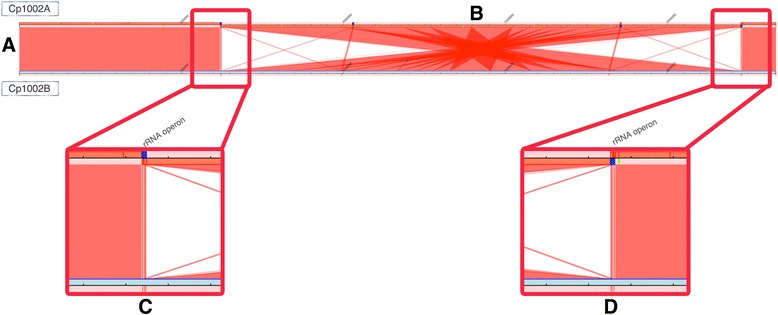
Syntenic comparison between the first assembly (Cp1002A) and the new assembly (Cp1002B). a The genome of Cp1002A is showed above, while the genome of Cp1002B in shown below. Red lines linking the line above and the line below indicate syntenic regions. The annotation of Cp1002A was used to insert color targets in the graph that detect repetitive regions: blue for rRNA operons, light blue for transposons, yellow for plasmids and green for phages. b The genomes are highly similar, except by a genetic inversion larger than 1 Mbp between two rRNA operons. c rRNA operon in the left side of the genetic inversion. It is possible to detect a change in the sense strand after the rRNA operon that indicates an inversion. d rRNA operon in the right side of the inversion sequence
