Fig. 5.

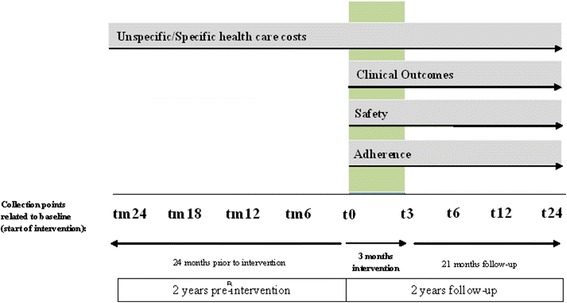
Collection points and outcome measures. Figure legend: t = collection point, m = minus. 0, 3, 6, 12, 24 = month of collection point related to baseline (t0)

Collection points and outcome measures. Figure legend: t = collection point, m = minus. 0, 3, 6, 12, 24 = month of collection point related to baseline (t0)