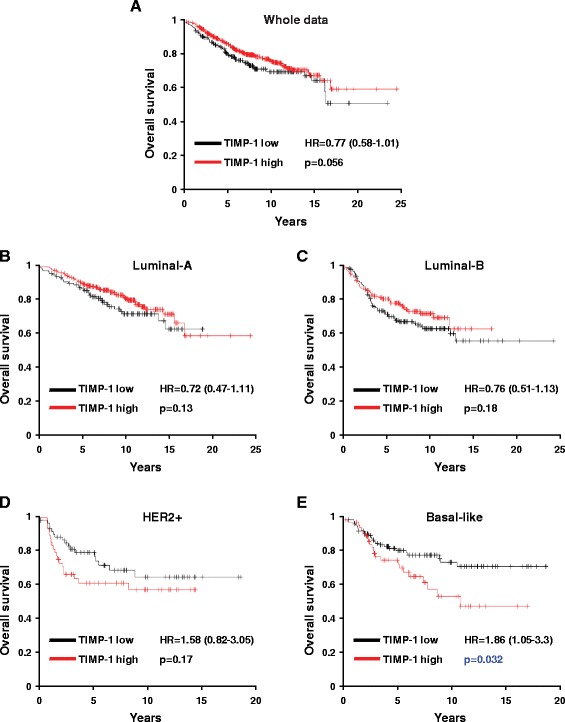
Fig. 2.

Kaplan-Meier plots of overall survival stratified by TIMP-1 expression levels. a Kaplan-Meier plots of overall survival in breast cancer patients from the whole data sets stratified by TIMP-1 expression levels. Data were obtained from the Kaplan-Meier plotter database [33]. The p value was calculated using the log rank test. b-e Kaplan-Meier plots of overall survival of Luminal-A, Luminal-B, HER2+ and basal-like breast cancer patients. TIMP-1 expression was associated with a poor prognosis in patients with basal-like cancer but not in the overall population or in the other breast cancer subtypes
