
Fig. 3.
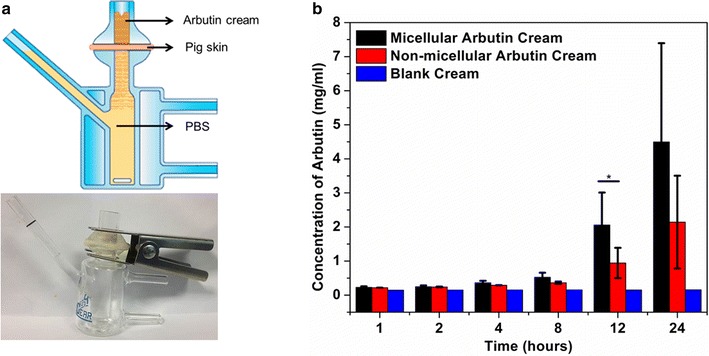
Ex vivo skin penetration experiment: a illustration and a photo of Franz cell experiment. b Quantification of arbutin in the receiving well during an 24-h incubation. *P < 0.05, **P < 0.01, as determined by one-way ANOVA
Official websites use .gov
A
.gov website belongs to an official
government organization in the United States.
Secure .gov websites use HTTPS
A lock (
) or https:// means you've safely
connected to the .gov website. Share sensitive
information only on official, secure websites.
Ex vivo skin penetration experiment: a illustration and a photo of Franz cell experiment. b Quantification of arbutin in the receiving well during an 24-h incubation. *P < 0.05, **P < 0.01, as determined by one-way ANOVA