
Fig. 1.
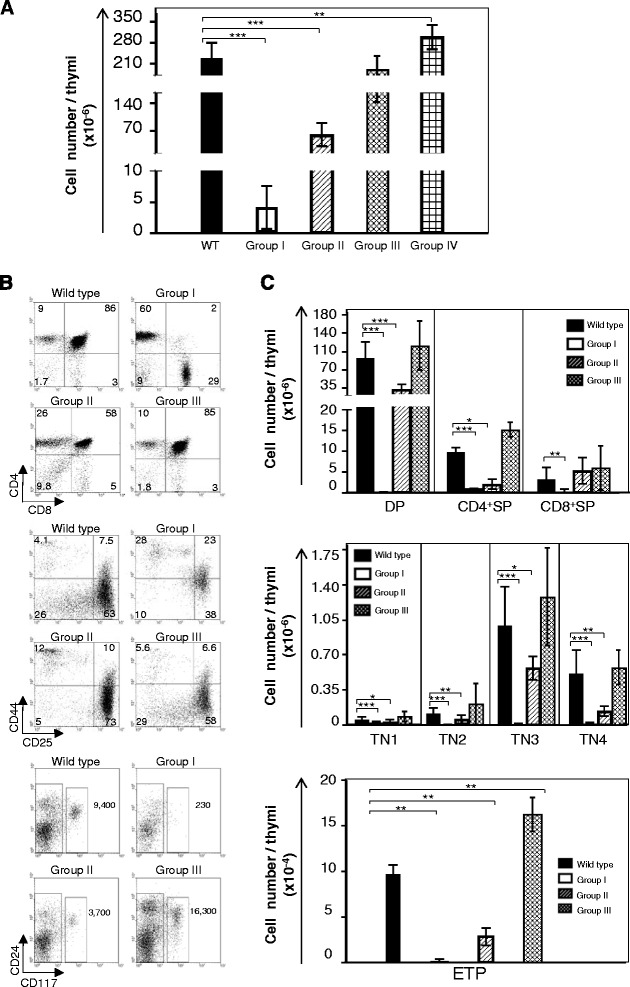
The thymocytes from 4 weeks old Ccnd1 Δ1-3 mice. a Thymocyte yields from different Groups of Ccnd1 Δ1-3 mice. The number of mice in each Group is shown in brackets: GrI (11), GrII (12), GrIII (25) and GrIV (10); results are expressed as the mean +/− SE. b The distribution of thymocyte populations. Dot plots are from a representative experiment in which 4-weeks-old littermates belonging to different Groups were studied simultaneously. Group IV is not shown, since 4-weeks-old mice do not have this Group. c Bar graphs represent the mean+/− SE from all mice we studied. The number of mice in each Group is shown in brackets: GrI (15) GrII (12) GrIII (26). Upper graphs: CD4/CD8 profiles in CD19−TER119−Gr-1− thymocytes. Middle graphs: CD44/CD25 profiles in triple negative (TN: CD3−CD8−CD4−CD19−TER119−Gr-1−) cells. Lower graphs: CD44+ CD25− TN1 populations, subdivided by their expression of CD24 and CD117. Numbers show the yields of ETPs (CD24+ CD117+)/thymus. Statistic significance: *p < 0.05; **p < 0.005; ***p < 0.001