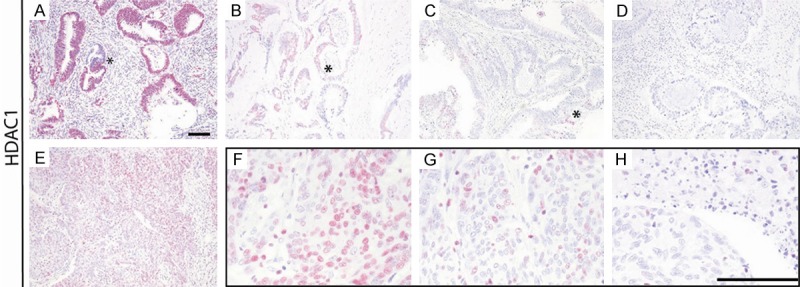
Figure 2.

Intratumoral and intraglandular heterogeneity of HDAC1 expression. The figure shows heterogeneity of HDAC1 expression in different CRC cases with expression levels >80% (A), 10-50% (B), <10% (C) and 0% (D), even within the same tumor gland (A-C; asterisks), and within one case with expression levels >80% (E), >50-80% (F), 10-50% (G) and <10% (H). Scale bars 100 µm.
